Capital One 2013 Annual Report Download - page 126
Download and view the complete annual report
Please find page 126 of the 2013 Capital One annual report below. You can navigate through the pages in the report by either clicking on the pages listed below, or by using the keyword search tool below to find specific information within the annual report.-
 1
1 -
2
-
3
-
4
-
5
-
6
-
7
-
8
-
9
-
10
-
11
-
12
-
13
-
14
-
15
-
16
-
17
-
18
-
19
-
20
-
21
-
22
-
23
-
24
-
25
-
26
-
27
-
28
-
29
-
30
-
31
-
32
-
33
-
34
-
35
-
36
-
37
-
38
-
39
-
40
-
41
-
42
-
43
-
44
-
45
-
46
-
47
-
48
-
49
-
50
-
51
-
52
-
53
-
54
-
55
-
56
-
57
-
58
-
59
-
60
-
61
-
62
-
63
-
64
-
65
-
66
-
67
-
68
-
69
-
70
-
71
-
72
-
73
-
74
-
75
-
76
-
77
-
78
-
79
-
80
-
81
-
82
-
83
-
84
-
85
-
86
-
87
-
88
-
89
-
90
-
91
-
92
-
93
-
94
-
95
-
96
-
97
-
98
-
99
-
100
-
101
-
102
-
103
-
104
-
105
-
106
-
107
-
108
-
109
-
110
-
111
-
112
-
113
-
114
-
115
-
 116
116 -
 117
117 -
 118
118 -
 119
119 -
 120
120 -
 121
121 -
 122
122 -
 123
123 -
 124
124 -
 125
125 -
 126
126 -
 127
127 -
 128
128 -
 129
129 -
 130
130 -
 131
131 -
 132
132 -
 133
133 -
 134
134 -
 135
135 -
 136
136 -
137
-
138
-
139
-
140
-
141
-
142
-
143
-
144
-
145
-
146
-
147
-
148
-
149
-
150
-
151
-
152
-
153
-
154
-
155
-
156
-
157
-
158
-
159
-
160
-
161
-
162
-
163
-
164
-
165
-
166
-
167
-
168
-
169
-
170
-
171
-
172
-
173
-
174
-
175
-
176
-
177
-
178
-
179
-
180
-
181
-
182
-
183
-
184
-
185
-
186
-
187
-
188
-
189
-
190
-
191
-
192
-
193
-
194
-
195
-
196
-
197
-
198
-
199
-
200
-
201
-
202
-
203
-
204
-
205
-
206
-
207
-
208
-
209
-
210
-
211
-
212
-
213
-
214
-
215
-
216
-
217
-
218
-
219
-
220
-
221
-
222
-
223
-
224
-
225
-
226
-
227
-
228
-
229
-
230
-
231
-
232
-
233
-
234
-
235
-
236
-
237
-
238
-
239
-
240
-
241
-
242
-
243
-
244
-
245
-
246
-
247
-
248
-
249
-
250
-
251
-
252
-
253
-
254
-
255
-
256
-
257
-
258
-
259
-
260
-
261
-
262
-
263
-
264
-
265
-
266
-
267
-
268
-
269
-
270
-
271
-
272
-
273
-
274
-
275
-
276
-
277
-
278
-
279
-
280
-
281
-
282
-
283
-
284
-
285
-
286
-
287
-
288
-
289
-
290
-
291
-
292
-
293
-
294
-
295
-
296
-
297
-
298
-
299
-
300
-
301
-
302
 |
 |

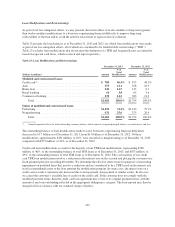
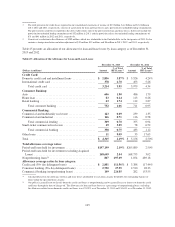
Our allowance decreased by $841 million to $4.3 billion as of December 31, 2013 from $5.2 billion as of
December 31, 2012. The reduction in the allowance was mainly due to a reduction in loan balances, an improved
credit outlook, and an allowance transfer of $289 million related to the Portfolio Sale.
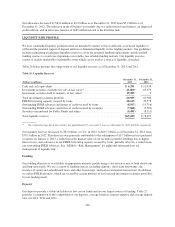
LIQUIDITY RISK PROFILE
We have established liquidity guidelines that are intended to ensure we have sufficient asset-based liquidity to
withstand the potential impact of deposit attrition or diminished liquidity in the funding markets. Our guidelines
include maintaining an adequate liquidity reserve to cover our potential funding requirements and diversified
funding sources to avoid over-dependence on volatile, less reliable funding markets. Our liquidity reserves
consist of readily-marketable or pledgable assets which can be used as a source of liquidity, if needed.
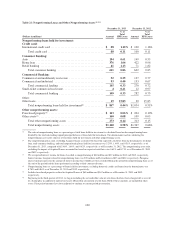
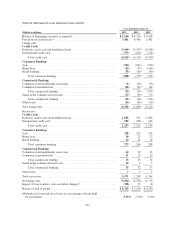
Table 26 below presents the composition of our liquidity reserves as of December 31, 2013 and 2012.
Table 26: Liquidity Reserves
(Dollars in millions)
December 31,
2013
December 31,
2012
Cash and cash equivalents ............................................... $ 6,291 $ 11,058
Investment securities available for sale, at fair value(1) ......................... 41,800 63,979
Investment securities held to maturity, at fair value(1) .......................... 19,185 9
Total investment securities portfolio ....................................... 60,985 63,988
FHLB borrowing capacity secured by loans ................................. 28,623 32,578
Outstanding FHLB advances and letters of credit secured by loans ............... (8,917) (15,716)
Outstanding FHLB advances and letters of credit secured by securities ............ (7,808) (5,500)
Securities encumbered for Public Funds and others ........................... (9,491) (8,311)
Total liquidity reserves ................................................. $69,683 $ 78,097
(1) The weighted average life of our securities was approximately 6.3 years and 4.3 years as of December 31, 2013 and 2012, respectively.
Our liquidity reserves decreased by $8.4 billion, or 11%, in 2013, to $69.7 billion as of December 31, 2013 from
$78.1 billion in 2012. This decrease was primarily attributable to the redemption of $3.7 billion in trust preferred
securities on January 2, 2013, a reduction in the market value of our securities portfolio holdings due to higher
interest rates, and a decrease in our FHLB borrowing capacity secured by loans, partially offset by a reduction in
our outstanding FHLB advances. See “MD&A—Risk Management” for additional information on our
management of liquidity risk.
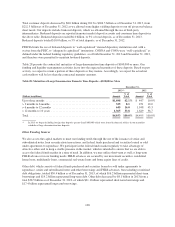
Funding
Our funding objective is to establish an appropriate maturity profile using a cost-effective mix of both short-term
and long-term funds. We use a variety of funding sources, including deposits, short-term borrowings, the
issuance of senior and subordinated notes and other borrowings, and loan securitization transactions. In addition,
we utilize FHLB advances, which are secured by certain portions of our loan and investment securities portfolios,
for our funding needs.
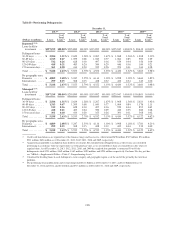
Deposits
Our deposits provide a stable and relatively low cost of funds and are our largest source of funding. Table 27
provides a comparison of the composition of our deposits, average balances, interest expense and average deposit
rates for 2013, 2012 and 2011.
106