Capital One 2013 Annual Report Download - page 124
Download and view the complete annual report
Please find page 124 of the 2013 Capital One annual report below. You can navigate through the pages in the report by either clicking on the pages listed below, or by using the keyword search tool below to find specific information within the annual report.-
 1
1 -
2
-
3
-
4
-
5
-
6
-
7
-
8
-
9
-
10
-
11
-
12
-
13
-
14
-
15
-
16
-
17
-
18
-
19
-
20
-
21
-
22
-
23
-
24
-
25
-
26
-
27
-
28
-
29
-
30
-
31
-
32
-
33
-
34
-
35
-
36
-
37
-
38
-
39
-
40
-
41
-
42
-
43
-
44
-
45
-
46
-
47
-
48
-
49
-
50
-
51
-
52
-
53
-
54
-
55
-
56
-
57
-
58
-
59
-
60
-
61
-
62
-
63
-
64
-
65
-
66
-
67
-
68
-
69
-
70
-
71
-
72
-
73
-
74
-
75
-
76
-
77
-
78
-
79
-
80
-
81
-
82
-
83
-
84
-
85
-
86
-
87
-
88
-
89
-
90
-
91
-
92
-
93
-
94
-
95
-
96
-
97
-
98
-
99
-
100
-
101
-
102
-
103
-
104
-
105
-
106
-
107
-
108
-
109
-
110
-
111
-
112
-
113
-
 114
114 -
 115
115 -
 116
116 -
 117
117 -
 118
118 -
 119
119 -
 120
120 -
 121
121 -
 122
122 -
 123
123 -
 124
124 -
 125
125 -
 126
126 -
 127
127 -
 128
128 -
 129
129 -
 130
130 -
 131
131 -
 132
132 -
 133
133 -
 134
134 -
135
-
136
-
137
-
138
-
139
-
140
-
141
-
142
-
143
-
144
-
145
-
146
-
147
-
148
-
149
-
150
-
151
-
152
-
153
-
154
-
155
-
156
-
157
-
158
-
159
-
160
-
161
-
162
-
163
-
164
-
165
-
166
-
167
-
168
-
169
-
170
-
171
-
172
-
173
-
174
-
175
-
176
-
177
-
178
-
179
-
180
-
181
-
182
-
183
-
184
-
185
-
186
-
187
-
188
-
189
-
190
-
191
-
192
-
193
-
194
-
195
-
196
-
197
-
198
-
199
-
200
-
201
-
202
-
203
-
204
-
205
-
206
-
207
-
208
-
209
-
210
-
211
-
212
-
213
-
214
-
215
-
216
-
217
-
218
-
219
-
220
-
221
-
222
-
223
-
224
-
225
-
226
-
227
-
228
-
229
-
230
-
231
-
232
-
233
-
234
-
235
-
236
-
237
-
238
-
239
-
240
-
241
-
242
-
243
-
244
-
245
-
246
-
247
-
248
-
249
-
250
-
251
-
252
-
253
-
254
-
255
-
256
-
257
-
258
-
259
-
260
-
261
-
262
-
263
-
264
-
265
-
266
-
267
-
268
-
269
-
270
-
271
-
272
-
273
-
274
-
275
-
276
-
277
-
278
-
279
-
280
-
281
-
282
-
283
-
284
-
285
-
286
-
287
-
288
-
289
-
290
-
291
-
292
-
293
-
294
-
295
-
296
-
297
-
298
-
299
-
300
-
301
-
302
 |
 |

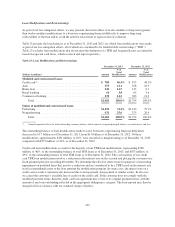
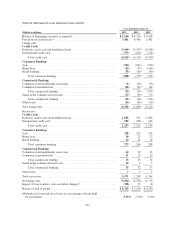
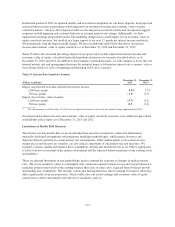
Table 24: Allowance for Loan and Lease Losses Activity
Year Ended December 31,
(Dollars in millions) 2013 2012 2011
Balance at beginning of period, as reported ............................... $ 5,156 $ 4,250 $ 5,628
Provision for credit losses(1) ........................................... 3,401 4,446 2,401
Charge-offs:
Credit Card:
Domestic credit card and installment loans ............................... (3,969) (3,507) (3,558)
International credit card .............................................. (573) (652) (752)
Total credit card ................................................ (4,542) (4,159) (4,310)
Consumer Banking:
Auto.............................................................. (784) (631) (529)
Home loan ......................................................... (26) (77) (104)
Retail banking ...................................................... (78) (89) (99)
Total consumer banking .......................................... (888) (797) (732)
Commercial Banking:
Commercial and multifamily real estate .................................. (6) (23) (76)
Commercial and industrial ............................................ (26) (32) (61)
Total commercial lending ......................................... (32) (55) (137)
Small-ticket commercial real estate ..................................... (17) (39) (77)
Total commercial banking ........................................ (49) (94) (214)
Other loans ........................................................ (26) (43) (59)
Total charge-offs .................................................... (5,505) (5,093) (5,315)
Recoveries:
Credit Card:
Domestic credit card and installment loans ............................... 1,065 975 1,036
International credit card .............................................. 192 240 218
Total credit card ................................................ 1,257 1,215 1,254
Consumer Banking:
Auto.............................................................. 238 217 195
Home loan ......................................................... 10 25 27
Retail banking ...................................................... 24 24 26
Total consumer banking .......................................... 272 266 248
Commercial Banking:
Commercial and multifamily real estate .................................. 14 18 12
Commercial and industrial ............................................ 11 25 20
Total commercial lending ......................................... 25 43 32
Small-ticket commercial real estate ..................................... 10 95
Total commercial banking ........................................ 35 52 37
Other loans ........................................................ 755
Total recoveries ..................................................... 1,571 1,538 1,544
Net charge-offs ..................................................... (3,934) (3,555) (3,771)
Impact of loan transfers, sales and other changes(2) ......................... (308) 15 (8)
Balance at end of period .............................................. $ 4,315 $ 5,156 $ 4,250
Allowance for loan and lease losses as a percentage of loans held
for investment .................................................... 2.19% 2.50% 3.13%
104