Capital One 2013 Annual Report Download - page 237
Download and view the complete annual report
Please find page 237 of the 2013 Capital One annual report below. You can navigate through the pages in the report by either clicking on the pages listed below, or by using the keyword search tool below to find specific information within the annual report.-
 1
1 -
2
-
3
-
4
-
5
-
6
-
7
-
8
-
9
-
10
-
11
-
12
-
13
-
14
-
15
-
16
-
17
-
18
-
19
-
20
-
21
-
22
-
23
-
24
-
25
-
26
-
27
-
28
-
29
-
30
-
31
-
32
-
33
-
34
-
35
-
36
-
37
-
38
-
39
-
40
-
41
-
42
-
43
-
44
-
45
-
46
-
47
-
48
-
49
-
50
-
51
-
52
-
53
-
54
-
55
-
56
-
57
-
58
-
59
-
60
-
61
-
62
-
63
-
64
-
65
-
66
-
67
-
68
-
69
-
70
-
71
-
72
-
73
-
74
-
75
-
76
-
77
-
78
-
79
-
80
-
81
-
82
-
83
-
84
-
85
-
86
-
87
-
88
-
89
-
90
-
91
-
92
-
93
-
94
-
95
-
96
-
97
-
98
-
99
-
100
-
101
-
102
-
103
-
104
-
105
-
106
-
107
-
108
-
109
-
110
-
111
-
112
-
113
-
114
-
115
-
116
-
117
-
118
-
119
-
120
-
121
-
122
-
123
-
124
-
125
-
126
-
127
-
128
-
129
-
130
-
131
-
132
-
133
-
134
-
135
-
136
-
137
-
138
-
139
-
140
-
141
-
142
-
143
-
144
-
145
-
146
-
147
-
148
-
149
-
150
-
151
-
152
-
153
-
154
-
155
-
156
-
157
-
158
-
159
-
160
-
161
-
162
-
163
-
164
-
165
-
166
-
167
-
168
-
169
-
170
-
171
-
172
-
173
-
174
-
175
-
176
-
177
-
178
-
179
-
180
-
181
-
182
-
183
-
184
-
185
-
186
-
187
-
188
-
189
-
190
-
191
-
192
-
193
-
194
-
195
-
196
-
197
-
198
-
199
-
200
-
201
-
202
-
203
-
204
-
205
-
206
-
207
-
208
-
209
-
210
-
211
-
212
-
213
-
214
-
215
-
216
-
217
-
218
-
219
-
220
-
221
-
222
-
223
-
224
-
225
-
226
-
 227
227 -
 228
228 -
 229
229 -
 230
230 -
 231
231 -
 232
232 -
 233
233 -
 234
234 -
 235
235 -
 236
236 -
 237
237 -
 238
238 -
 239
239 -
 240
240 -
 241
241 -
 242
242 -
 243
243 -
 244
244 -
 245
245 -
 246
246 -
 247
247 -
248
-
249
-
250
-
251
-
252
-
253
-
254
-
255
-
256
-
257
-
258
-
259
-
260
-
261
-
262
-
263
-
264
-
265
-
266
-
267
-
268
-
269
-
270
-
271
-
272
-
273
-
274
-
275
-
276
-
277
-
278
-
279
-
280
-
281
-
282
-
283
-
284
-
285
-
286
-
287
-
288
-
289
-
290
-
291
-
292
-
293
-
294
-
295
-
296
-
297
-
298
-
299
-
300
-
301
-
302
 |
 |

CAPITAL ONE FINANCIAL CORPORATION
NOTES TO CONSOLIDATED FINANCIAL STATEMENTS—(Continued)
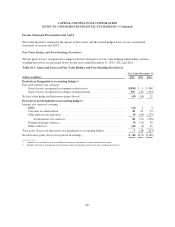
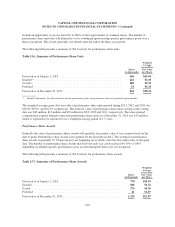
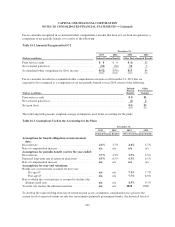
The following table presents the weighted average assumptions used to value stock options granted during 2013,
2012 and 2011.
Table 15.4: Fair Value of Stock Options Granted
Year Ended December 31,
Assumptions 2013 2012 2011
Dividend yield(1) ................................................. 2.29% 1.70% 2.34%
Volatility(2) ..................................................... 32.00 35.00 36.00
Risk-free interest rate(3) ............................................ 1.07 0.74 2.04
Expected option lives(4) ............................................ 5.6 years 5.0 years 5.0 years
(1) Represents the expected dividend rate over the life of the option.
(2) Based on the implied volatility of exchange-traded options.
(3) Based on the U.S. Treasury yield curve.
(4) Represents the period of time that options granted are expected to remain outstanding and based on historical activities.
Restricted Stock Awards and Units
Generally, the value of restricted stock awards and units will equal the fair market value of our common stock on
the date of grant. Restricted stock generally vests at 33 1/3 percent per year beginning on or shortly after the first
anniversary of the grant date; however, some restricted stock units cliff vest on or shortly after the first
anniversary of the grant date. In addition, vesting is subject to the achievement of any applicable performance
conditions.
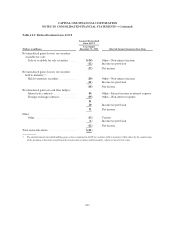
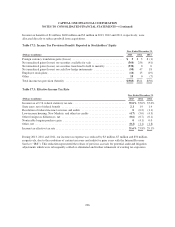
The following table presents a summary of 2013 activity for restricted stock awards and units.
Table 15.5: Summary of Restricted Stock Awards
Shares
(in thousands)
Weighted
Average
Grant Date
Fair Value
per Share
Unvested as of January 1, 2013 ............................................ 2,409 $46.09
Granted ............................................................... 1,045 58.90
Vested ................................................................ 1,084 43.62
Forfeited .............................................................. 182 50.41
Unvested as of December 31, 2013 ......................................... 2,188 $53.07
The weighted-average grant date fair value of restricted stock in 2013, 2012 and 2011 was $58.90, $46.89 and
$47.36, respectively. The total fair value of restricted stock as of the vesting date was $62 million, $107 million
and $95 million in 2013, 2012 and 2011, respectively. The unrecognized compensation expense related to
unvested restricted stock awards and units as of December 31, 2013 was $54 million, which is expected to be
amortized over a weighted-average period of 1.5 years.
Performance Share Units
Generally, the value of performance share units will equal the fair market value of our common stock on the date
of grant. The performance share unit awards granted in 2013 include an opportunity to receive from 0% to 150%
of the target number of common shares, while the performance share unit awards granted in 2012 and 2011
217