Capital One 2013 Annual Report Download - page 92
Download and view the complete annual report
Please find page 92 of the 2013 Capital One annual report below. You can navigate through the pages in the report by either clicking on the pages listed below, or by using the keyword search tool below to find specific information within the annual report.-
 1
1 -
2
-
3
-
4
-
5
-
6
-
7
-
8
-
9
-
10
-
11
-
12
-
13
-
14
-
15
-
16
-
17
-
18
-
19
-
20
-
21
-
22
-
23
-
24
-
25
-
26
-
27
-
28
-
29
-
30
-
31
-
32
-
33
-
34
-
35
-
36
-
37
-
38
-
39
-
40
-
41
-
42
-
43
-
44
-
45
-
46
-
47
-
48
-
49
-
50
-
51
-
52
-
53
-
54
-
55
-
56
-
57
-
58
-
59
-
60
-
61
-
62
-
63
-
64
-
65
-
66
-
67
-
68
-
69
-
70
-
71
-
72
-
73
-
74
-
75
-
76
-
77
-
78
-
79
-
80
-
81
-
 82
82 -
 83
83 -
 84
84 -
 85
85 -
 86
86 -
 87
87 -
 88
88 -
 89
89 -
 90
90 -
 91
91 -
 92
92 -
 93
93 -
 94
94 -
 95
95 -
 96
96 -
 97
97 -
 98
98 -
 99
99 -
 100
100 -
 101
101 -
 102
102 -
103
-
104
-
105
-
106
-
107
-
108
-
109
-
110
-
111
-
112
-
113
-
114
-
115
-
116
-
117
-
118
-
119
-
120
-
121
-
122
-
123
-
124
-
125
-
126
-
127
-
128
-
129
-
130
-
131
-
132
-
133
-
134
-
135
-
136
-
137
-
138
-
139
-
140
-
141
-
142
-
143
-
144
-
145
-
146
-
147
-
148
-
149
-
150
-
151
-
152
-
153
-
154
-
155
-
156
-
157
-
158
-
159
-
160
-
161
-
162
-
163
-
164
-
165
-
166
-
167
-
168
-
169
-
170
-
171
-
172
-
173
-
174
-
175
-
176
-
177
-
178
-
179
-
180
-
181
-
182
-
183
-
184
-
185
-
186
-
187
-
188
-
189
-
190
-
191
-
192
-
193
-
194
-
195
-
196
-
197
-
198
-
199
-
200
-
201
-
202
-
203
-
204
-
205
-
206
-
207
-
208
-
209
-
210
-
211
-
212
-
213
-
214
-
215
-
216
-
217
-
218
-
219
-
220
-
221
-
222
-
223
-
224
-
225
-
226
-
227
-
228
-
229
-
230
-
231
-
232
-
233
-
234
-
235
-
236
-
237
-
238
-
239
-
240
-
241
-
242
-
243
-
244
-
245
-
246
-
247
-
248
-
249
-
250
-
251
-
252
-
253
-
254
-
255
-
256
-
257
-
258
-
259
-
260
-
261
-
262
-
263
-
264
-
265
-
266
-
267
-
268
-
269
-
270
-
271
-
272
-
273
-
274
-
275
-
276
-
277
-
278
-
279
-
280
-
281
-
282
-
283
-
284
-
285
-
286
-
287
-
288
-
289
-
290
-
291
-
292
-
293
-
294
-
295
-
296
-
297
-
298
-
299
-
300
-
301
-
302
 |
 |

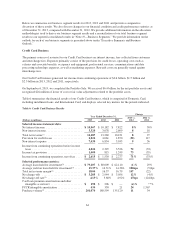
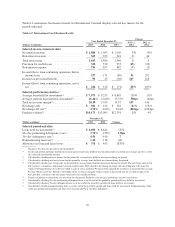
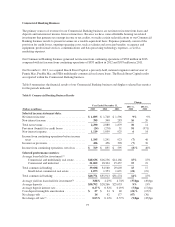
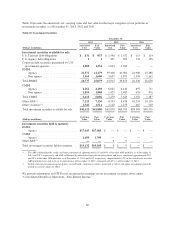
Table 7 summarizes the financial results of our Consumer Banking business and displays selected key metrics for
the periods indicated.
Table 7: Consumer Banking Business Results
(Dollars in millions)
Change
Year Ended December 31, 2013 vs.
2012
2012 vs.
20112013 2012 2011
Selected income statement data:
Net interest income ........................... $ 5,905 $ 5,788 $ 4,236 2% 37%
Non-interest income ........................... 749 782 720 (4) 9
Total net revenue ............................. 6,654 6,570 4,956 133
Provision for credit losses ...................... 656 589 452 11 30
Non-interest expense .......................... 3,745 3,871 3,244 (3) 19
Income from continuing operations before income
taxes ..................................... 2,253 2,110 1,260 767
Income tax provision .......................... 802 747 451 766
Income from continuing operations, net of tax ...... $ 1,451 $ 1,363 $ 809 6% 68%
Selected performance metrics:
Average loans held for investment:(1)
Auto ................................... $ 29,446 $ 24,976 $19,419 18% 29%
Home loan .............................. 39,322 42,764 11,322 (8) 278
Retail banking ........................... 3,699 4,096 4,097 (10) —
Total consumer banking ....................... $ 72,467 $ 71,836 $34,838 1% 106%
Average yield on loans held for investment(2) ....... 6.10% 6.28% 9.60% (18)bps (332)bps
Average deposits ............................. $169,683 $162,637 $86,883 4% 87%
Average deposit interest rate .................... 0.63% 0.70% 0.96% (7)bps (26)bps
Core deposit intangible amortization . ............. $ 138 $ 159 $ 132 (13)% 20%
Net charge-offs .............................. 616 531 484 16 10
Net charge-off rate(3) .......................... 0.85% 0.74% 1.39% 11bps (65)bps
Net charge-off rate (excluding Acquired Loans)(4) ... 1.51 1.45 1.59 6(14)
Auto loan originations ......................... $ 17,388 $ 15,960 $12,476 9% 28%
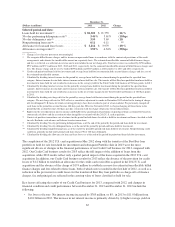
(Dollars in millions)
December 31,
Change2013 2012
Selected period-end data:
Loans held for investment:(1)
Auto ................................... $ 31,857 $ 27,123 17%
Home loan .............................. 35,282 44,100 (20)
Retail banking ........................... 3,623 3,904 (7)
Total consumer banking ....................... $ 70,762 $ 75,127 (6)%
30+ day performing delinquency rate(5) ............ 3.20% 2.65% 55bps
30+ day performing delinquency rate (excluding
Acquired Loans)(4) .......................... 5.32 5.14 18
30+ day delinquency rate(6) ..................... 3.89 3.34 55
30+ day delinquency rate (excluding Acquired
Loans)(4) .................................. 6.47 6.49 (2)
Nonperforming loans rate(7) ..................... 0.86 0.85 1
Nonperforming loans rate (excluding Acquired
Loans)(4) .................................. 1.44 1.66 (22)
Nonperforming asset rate(8) ..................... 1.12 1.02 10
Nonperforming asset rate (excluding Acquired
Loans)(4) .................................. 1.86 1.98 (12)
Allowance for loan and lease losses .............. $ 752 $ 711 6%
Allowance coverage ratio(9) ..................... 1.06% 0.95% 11bps
Deposits .................................... $167,652 $172,396 (3)%
Loans serviced for others ....................... 7,665 15,333 (50)
72