Capital One 2013 Annual Report Download - page 152
Download and view the complete annual report
Please find page 152 of the 2013 Capital One annual report below. You can navigate through the pages in the report by either clicking on the pages listed below, or by using the keyword search tool below to find specific information within the annual report.-
 1
1 -
2
-
3
-
4
-
5
-
6
-
7
-
8
-
9
-
10
-
11
-
12
-
13
-
14
-
15
-
16
-
17
-
18
-
19
-
20
-
21
-
22
-
23
-
24
-
25
-
26
-
27
-
28
-
29
-
30
-
31
-
32
-
33
-
34
-
35
-
36
-
37
-
38
-
39
-
40
-
41
-
42
-
43
-
44
-
45
-
46
-
47
-
48
-
49
-
50
-
51
-
52
-
53
-
54
-
55
-
56
-
57
-
58
-
59
-
60
-
61
-
62
-
63
-
64
-
65
-
66
-
67
-
68
-
69
-
70
-
71
-
72
-
73
-
74
-
75
-
76
-
77
-
78
-
79
-
80
-
81
-
82
-
83
-
84
-
85
-
86
-
87
-
88
-
89
-
90
-
91
-
92
-
93
-
94
-
95
-
96
-
97
-
98
-
99
-
100
-
101
-
102
-
103
-
104
-
105
-
106
-
107
-
108
-
109
-
110
-
111
-
112
-
113
-
114
-
115
-
116
-
117
-
118
-
119
-
120
-
121
-
122
-
123
-
124
-
125
-
126
-
127
-
128
-
129
-
130
-
131
-
132
-
133
-
134
-
135
-
136
-
137
-
138
-
139
-
140
-
141
-
 142
142 -
 143
143 -
 144
144 -
 145
145 -
 146
146 -
 147
147 -
 148
148 -
 149
149 -
 150
150 -
 151
151 -
 152
152 -
 153
153 -
 154
154 -
 155
155 -
 156
156 -
 157
157 -
 158
158 -
 159
159 -
 160
160 -
 161
161 -
 162
162 -
163
-
164
-
165
-
166
-
167
-
168
-
169
-
170
-
171
-
172
-
173
-
174
-
175
-
176
-
177
-
178
-
179
-
180
-
181
-
182
-
183
-
184
-
185
-
186
-
187
-
188
-
189
-
190
-
191
-
192
-
193
-
194
-
195
-
196
-
197
-
198
-
199
-
200
-
201
-
202
-
203
-
204
-
205
-
206
-
207
-
208
-
209
-
210
-
211
-
212
-
213
-
214
-
215
-
216
-
217
-
218
-
219
-
220
-
221
-
222
-
223
-
224
-
225
-
226
-
227
-
228
-
229
-
230
-
231
-
232
-
233
-
234
-
235
-
236
-
237
-
238
-
239
-
240
-
241
-
242
-
243
-
244
-
245
-
246
-
247
-
248
-
249
-
250
-
251
-
252
-
253
-
254
-
255
-
256
-
257
-
258
-
259
-
260
-
261
-
262
-
263
-
264
-
265
-
266
-
267
-
268
-
269
-
270
-
271
-
272
-
273
-
274
-
275
-
276
-
277
-
278
-
279
-
280
-
281
-
282
-
283
-
284
-
285
-
286
-
287
-
288
-
289
-
290
-
291
-
292
-
293
-
294
-
295
-
296
-
297
-
298
-
299
-
300
-
301
-
302
 |
 |

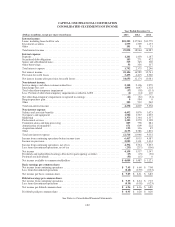
CAPITAL ONE FINANCIAL CORPORATION
CONSOLIDATED STATEMENTS OF INCOME
Year Ended December 31,
(Dollars in millions, except per share-related data) 2013 2012 2011
Interest income:
Loans, including loans held for sale .............................................. $18,222 $17,544 $13,779
Investment securities .......................................................... 1,575 1,329 1,137
Other ...................................................................... 101 91 71
Total interest income .......................................................... 19,898 18,964 14,987
Interest expense:
Deposits .................................................................... 1,241 1,403 1,187
Securitized debt obligations .................................................... 183 271 422
Senior and subordinated notes ................................................... 315 345 300
Other borrowings ............................................................. 53 356 337
Total interest expense ......................................................... 1,792 2,375 2,246
Net interest income ........................................................... 18,106 16,589 12,741
Provision for credit losses ...................................................... 3,453 4,415 2,360
Net interest income after provision for credit losses .................................. 14,653 12,174 10,381
Non-interest income:
Service charges and other customer-related fees .................................... 2,118 2,106 1,979
Interchange fees, net .......................................................... 1,896 1,647 1,318
Total other-than-temporary impairment ........................................... (37) (38) (131)
Less: Portion of other-than-temporary impairment recorded in AOCI .................... (4) (14) 110
Net other-than-temporary impairment recognized in earnings .......................... (41) (52) (21)
Bargain purchase gain ......................................................... 0594 0
Other ...................................................................... 305 512 262
Total non-interest income ...................................................... 4,278 4,807 3,538
Non-interest expense:
Salaries and associate benefits .................................................. 4,432 3,876 3,023
Occupancy and equipment ..................................................... 1,504 1,327 1,025
Marketing .................................................................. 1,373 1,364 1,337
Professional services .......................................................... 1,303 1,270 1,198
Communications and data processing ............................................. 885 778 681
Amortization of intangibles ..................................................... 671 609 222
Acquisition-related ........................................................... 193 336 45
Other ...................................................................... 2,153 2,386 1,801
Total non-interest expense ..................................................... 12,514 11,946 9,332
Income from continuing operations before income taxes .............................. 6,417 5,035 4,587
Income tax provision .......................................................... 2,025 1,301 1,334
Income from continuing operations, net of tax ...................................... 4,392 3,734 3,253
Loss from discontinued operations, net of tax ...................................... (233) (217) (106)
Net income ................................................................. 4,159 3,517 3,147
Dividends and undistributed earnings allocated to participating securities ................ (17) (15) (26)
Preferred stock dividends ...................................................... (53) (15) 0
Net income available to common stockholders ...................................... $ 4,089 $ 3,487 $ 3,121
Basic earnings per common share:
Net income from continuing operations ........................................... $ 7.45 $ 6.60 $ 7.08
Loss from discontinued operations ............................................... (0.40) (0.39) (0.23)
Net income per basic common share .............................................. $ 7.05 $ 6.21 $ 6.85
Diluted earnings per common share:
Net income from continuing operations ........................................... $ 7.35 $ 6.54 $ 7.03
Loss from discontinued operations ............................................... (0.39) (0.38) (0.23)
Net income per diluted common share ............................................ $ 6.96 $ 6.16 $ 6.80
Dividends paid per common share ............................................... $ 0.95 $ 0.20 $ 0.20
See Notes to Consolidated Financial Statements.
132