Capital One 2013 Annual Report Download - page 140
Download and view the complete annual report
Please find page 140 of the 2013 Capital One annual report below. You can navigate through the pages in the report by either clicking on the pages listed below, or by using the keyword search tool below to find specific information within the annual report.-
 1
1 -
2
-
3
-
4
-
5
-
6
-
7
-
8
-
9
-
10
-
11
-
12
-
13
-
14
-
15
-
16
-
17
-
18
-
19
-
20
-
21
-
22
-
23
-
24
-
25
-
26
-
27
-
28
-
29
-
30
-
31
-
32
-
33
-
34
-
35
-
36
-
37
-
38
-
39
-
40
-
41
-
42
-
43
-
44
-
45
-
46
-
47
-
48
-
49
-
50
-
51
-
52
-
53
-
54
-
55
-
56
-
57
-
58
-
59
-
60
-
61
-
62
-
63
-
64
-
65
-
66
-
67
-
68
-
69
-
70
-
71
-
72
-
73
-
74
-
75
-
76
-
77
-
78
-
79
-
80
-
81
-
82
-
83
-
84
-
85
-
86
-
87
-
88
-
89
-
90
-
91
-
92
-
93
-
94
-
95
-
96
-
97
-
98
-
99
-
100
-
101
-
102
-
103
-
104
-
105
-
106
-
107
-
108
-
109
-
110
-
111
-
112
-
113
-
114
-
115
-
116
-
117
-
118
-
119
-
120
-
121
-
122
-
123
-
124
-
125
-
126
-
127
-
128
-
129
-
 130
130 -
 131
131 -
 132
132 -
 133
133 -
 134
134 -
 135
135 -
 136
136 -
 137
137 -
 138
138 -
 139
139 -
 140
140 -
 141
141 -
 142
142 -
 143
143 -
 144
144 -
 145
145 -
 146
146 -
 147
147 -
 148
148 -
 149
149 -
 150
150 -
151
-
152
-
153
-
154
-
155
-
156
-
157
-
158
-
159
-
160
-
161
-
162
-
163
-
164
-
165
-
166
-
167
-
168
-
169
-
170
-
171
-
172
-
173
-
174
-
175
-
176
-
177
-
178
-
179
-
180
-
181
-
182
-
183
-
184
-
185
-
186
-
187
-
188
-
189
-
190
-
191
-
192
-
193
-
194
-
195
-
196
-
197
-
198
-
199
-
200
-
201
-
202
-
203
-
204
-
205
-
206
-
207
-
208
-
209
-
210
-
211
-
212
-
213
-
214
-
215
-
216
-
217
-
218
-
219
-
220
-
221
-
222
-
223
-
224
-
225
-
226
-
227
-
228
-
229
-
230
-
231
-
232
-
233
-
234
-
235
-
236
-
237
-
238
-
239
-
240
-
241
-
242
-
243
-
244
-
245
-
246
-
247
-
248
-
249
-
250
-
251
-
252
-
253
-
254
-
255
-
256
-
257
-
258
-
259
-
260
-
261
-
262
-
263
-
264
-
265
-
266
-
267
-
268
-
269
-
270
-
271
-
272
-
273
-
274
-
275
-
276
-
277
-
278
-
279
-
280
-
281
-
282
-
283
-
284
-
285
-
286
-
287
-
288
-
289
-
290
-
291
-
292
-
293
-
294
-
295
-
296
-
297
-
298
-
299
-
300
-
301
-
302
 |
 |
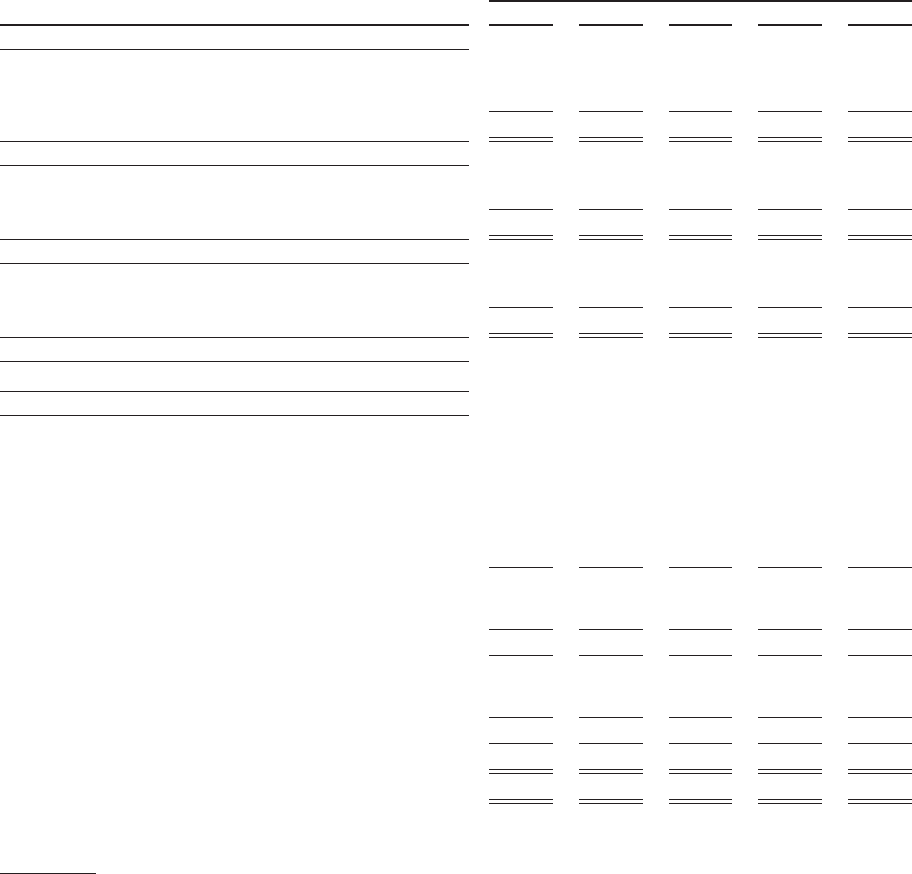
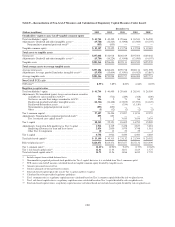
Table F—Reconciliation of Non-GAAP Measures and Calculation of Regulatory Capital Measures Under Basel I
December 31,
(Dollars in millions) 2013 2012 2011 2010 2009
Stockholders’ equity to non-GAAP tangible common equity
Total stockholders’ equity .................................. $ 41,744 $ 40,499 $ 29,666 $ 26,541 $ 26,590
Adjustments: Goodwill and other intangible assets(1) ............. (15,784) (16,224) (13,908) (13,983) (14,107)
Noncumulative perpetual preferred stock(2) ................ (853) (853) — — —
Tangible common equity ................................... $ 25,107 $ 23,422 $ 15,758 $ 12,558 $ 12,483
Total assets to tangible assets
Total assets ............................................. $297,048 $312,918 $206,019 $197,503 $169,646
Adjustments: Goodwill and other intangible assets(1) ............. (15,784) (16,224) (13,908) (13,983) (14,107)
Tangible assets .......................................... $281,264 $296,694 $192,111 $183,520 $155,539
Total average assets to average tangible assets
Average total assets ....................................... $297,284 $286,602 $199,718 $200,114 $171,598
Adjustments: Average goodwill and other intangible assets(1) ...... (15,938) (15,604) (13,981) (14,025) (13,867)
Average tangible assets .................................... $281,346 $270,998 $185,737 $186,089 $157,731
Non-GAAP TCE ratio
TCE ratio(3) ............................................. 8.93% 7.89% 8.20% 6.84% 8.03%
Regulatory capital ratios
Total stockholders’ equity .................................. $ 41,744 $ 40,499 $ 29,666 $ 26,541 $ 26,590
Adjustments: Net unrealized (gains) losses on investment securities
available for sale recorded in AOCI(4) .................... 791 (712) (289) (368) (200)
Net losses on cash flow hedges recorded in AOCI(4) ........ 136 2 71 86 92
Disallowed goodwill and other intangible assets ............ (14,326) (14,428) (13,855) (13,953) (14,125)
Disallowed deferred tax assets .......................... —— (534) (1,150) —
Noncumulative perpetual preferred stock(2) ................ (853) (853) — — —
Other ............................................. (5) (12) (2) (2) (2)
Tier 1 common capital ..................................... 27,487 24,496 15,057 11,154 12,355
Adjustments: Noncumulative perpetual preferred stock(2) ......... 853 853———
Tier 1 restricted core capital items(5) ..................... 22 3,635 3,636 3,634
Tier 1 capital ............................................ 28,342 25,351 18,692 14,790 15,989
Adjustments: Long-term debt qualifying as Tier 2 capital ......... 1,914 2,119 2,438 2,827 3,018
Qualifying allowance for loan and lease losses ............. 2,834 2,830 1,979 3,748 1,581
Other Tier 2 components .............................. 10 13 23 29 4
Tier 2 capital ............................................ 4,758 4,962 4,440 6,604 4,603
Total risk-based capital(6) .................................. $ 33,100 $ 30,313 $ 23,132 $ 21,394 $ 20,592
Risk-weighted assets(7) .................................... $224,671 $223,472 $155,657 $127,132 $116,309
Tier 1 common ratio(8) ..................................... 12.23% 10.96% 9.67% 8.77% 10.62%
Tier 1 risk-based capital ratio(9) .............................. 12.61 11.34 12.01 11.63 13.75
Total risk-based capital ratio(10) .............................. 14.73 13.56 14.86 16.83 17.70
(1) Includes impact from related deferred taxes.
(2) Noncumulative perpetual preferred stock qualifies for Tier 1 capital; however, it is excluded from Tier 1 common capital.
(3) TCE ratio is non-GAAP measure calculated based on tangible common equity divided by tangible assets.
(4) Amounts presented are net of tax.
(5) Consists primarily of trust preferred securities.
(6) Total risk-based capital equals the sum of Tier 1 capital and Tier 2 capital.
(7) Calculated based on prescribed regulatory guidelines.
(8) Tier 1 common ratio is a regulatory capital measure calculated based on Tier 1 common capital divided by risk-weighted assets.
(9) Tier 1 risk-based capital ratio is a regulatory capital measure calculated based on Tier 1 capital divided by risk-weighted assets.
(10) Total risk-based capital ratio is a regulatory capital measure calculated based on total risk-based capital divided by risk-weighted assets.
120