Capital One 2013 Annual Report Download - page 7
Download and view the complete annual report
Please find page 7 of the 2013 Capital One annual report below. You can navigate through the pages in the report by either clicking on the pages listed below, or by using the keyword search tool below to find specific information within the annual report.-
 1
1 -
 2
2 -
 3
3 -
 4
4 -
 5
5 -
 6
6 -
 7
7 -
 8
8 -
 9
9 -
 10
10 -
 11
11 -
 12
12 -
 13
13 -
 14
14 -
 15
15 -
 16
16 -
 17
17 -
 18
18 -
19
-
20
-
21
-
22
-
23
-
24
-
25
-
26
-
27
-
28
-
29
-
30
-
31
-
32
-
33
-
34
-
35
-
36
-
37
-
38
-
39
-
40
-
41
-
42
-
43
-
44
-
45
-
46
-
47
-
48
-
49
-
50
-
51
-
52
-
53
-
54
-
55
-
56
-
57
-
58
-
59
-
60
-
61
-
62
-
63
-
64
-
65
-
66
-
67
-
68
-
69
-
70
-
71
-
72
-
73
-
74
-
75
-
76
-
77
-
78
-
79
-
80
-
81
-
82
-
83
-
84
-
85
-
86
-
87
-
88
-
89
-
90
-
91
-
92
-
93
-
94
-
95
-
96
-
97
-
98
-
99
-
100
-
101
-
102
-
103
-
104
-
105
-
106
-
107
-
108
-
109
-
110
-
111
-
112
-
113
-
114
-
115
-
116
-
117
-
118
-
119
-
120
-
121
-
122
-
123
-
124
-
125
-
126
-
127
-
128
-
129
-
130
-
131
-
132
-
133
-
134
-
135
-
136
-
137
-
138
-
139
-
140
-
141
-
142
-
143
-
144
-
145
-
146
-
147
-
148
-
149
-
150
-
151
-
152
-
153
-
154
-
155
-
156
-
157
-
158
-
159
-
160
-
161
-
162
-
163
-
164
-
165
-
166
-
167
-
168
-
169
-
170
-
171
-
172
-
173
-
174
-
175
-
176
-
177
-
178
-
179
-
180
-
181
-
182
-
183
-
184
-
185
-
186
-
187
-
188
-
189
-
190
-
191
-
192
-
193
-
194
-
195
-
196
-
197
-
198
-
199
-
200
-
201
-
202
-
203
-
204
-
205
-
206
-
207
-
208
-
209
-
210
-
211
-
212
-
213
-
214
-
215
-
216
-
217
-
218
-
219
-
220
-
221
-
222
-
223
-
224
-
225
-
226
-
227
-
228
-
229
-
230
-
231
-
232
-
233
-
234
-
235
-
236
-
237
-
238
-
239
-
240
-
241
-
242
-
243
-
244
-
245
-
246
-
247
-
248
-
249
-
250
-
251
-
252
-
253
-
254
-
255
-
256
-
257
-
258
-
259
-
260
-
261
-
262
-
263
-
264
-
265
-
266
-
267
-
268
-
269
-
270
-
271
-
272
-
273
-
274
-
275
-
276
-
277
-
278
-
279
-
280
-
281
-
282
-
283
-
284
-
285
-
286
-
287
-
288
-
289
-
290
-
291
-
292
-
293
-
294
-
295
-
296
-
297
-
298
-
299
-
300
-
301
-
302
 |
 |

5
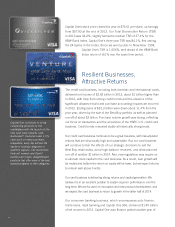
profitable growth and is now one of the four largest bank auto lenders in the
nation. New loan originations were about $17.4 billion in 2013 compared to
$16.0 billion in 2012. Credit losses increased modestly, as expected, but
remain low by historical standards. The charge-off rate in 2013 was 1.85%
compared to 1.66% in 2012. We expect that increased competition will
continue to have negative effects on margins, credit, and returns in
2014, but we still expect solid overall profitability and attractive returns
in the auto finance business.
Profitability in the home loans business improved in 2013,
driven by favorable credit trends. Actual credit losses are
trending better than the lifetime losses we estimated at the
time of the acquisitions. This outperformance flows into net
income over the life of the loans.
Planned run-off of acquired mortgage portfolios continues
as customers refinance or pay down their loans. The 2013
run-off was roughly $9 billion and we expect another $4 billion
in 2014. We continue to invest to ensure that our originations
and servicing businesses are well-managed.
Our combined retail and direct banking business made
tremendous progress in lowering costs and improving
profitability. While balance, mix, customer experience, and cost
trends are improving, low interest rates are likely to continue to
pressure the economics of our retail deposit businesses even
if rates begin to rise in 2014.
The strong growth and attractive returns in our commercial
banking business continued in 2013. Despite ongoing pressure
on loan and deposit margins, overall revenue rose by 10%,
while loan growth was 16%. Net income of $769 million was down
from 2012, when we recorded significant allowance releases.
Commercial credit performance was resilient throughout the
Great Recession and continued to improve in 2013. While the
year-end charge-off rate of 3 basis points is unsustainably low,
we continue to see low levels of non-performing and criticized
loan balances, so we expect credit performance to remain
strong. Our investments to build industry and product specialization
have paid off and position the commercial banking business for
continued success in 2014.
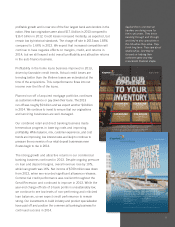
Vacation Ownership
Products and services offered by Capital One, N.A., member FDIC. © 2013 Capital One. All rights reserved.
When your vision needs financing, count on Capital One® to step up with
creative solutions. With over 100 years of combined experience, plus the
resources of a top-10 U.S. bank, our timeshare experts can help turn your
dream into reality with the expertise, insight, and financing you need.
James Casey
james.casey@capitalone.com
(860) 348-8861
capitalonecommercial.com
Michael Szwajkowski
michael.szwajkowski@capitalone.com
(21 2 ) 8 3 4 -1101
Capital One’s commercial
bankers are doing more for
their customers. They know
banking through and through,
and they’re also specialists in
the industries they serve. They
think long term. They care about
relationships. And they’re
focused on helping their
customers grow and stay
in excellent financial shape.