Capital One 2013 Annual Report Download - page 155
Download and view the complete annual report
Please find page 155 of the 2013 Capital One annual report below. You can navigate through the pages in the report by either clicking on the pages listed below, or by using the keyword search tool below to find specific information within the annual report.-
 1
1 -
2
-
3
-
4
-
5
-
6
-
7
-
8
-
9
-
10
-
11
-
12
-
13
-
14
-
15
-
16
-
17
-
18
-
19
-
20
-
21
-
22
-
23
-
24
-
25
-
26
-
27
-
28
-
29
-
30
-
31
-
32
-
33
-
34
-
35
-
36
-
37
-
38
-
39
-
40
-
41
-
42
-
43
-
44
-
45
-
46
-
47
-
48
-
49
-
50
-
51
-
52
-
53
-
54
-
55
-
56
-
57
-
58
-
59
-
60
-
61
-
62
-
63
-
64
-
65
-
66
-
67
-
68
-
69
-
70
-
71
-
72
-
73
-
74
-
75
-
76
-
77
-
78
-
79
-
80
-
81
-
82
-
83
-
84
-
85
-
86
-
87
-
88
-
89
-
90
-
91
-
92
-
93
-
94
-
95
-
96
-
97
-
98
-
99
-
100
-
101
-
102
-
103
-
104
-
105
-
106
-
107
-
108
-
109
-
110
-
111
-
112
-
113
-
114
-
115
-
116
-
117
-
118
-
119
-
120
-
121
-
122
-
123
-
124
-
125
-
126
-
127
-
128
-
129
-
130
-
131
-
132
-
133
-
134
-
135
-
136
-
137
-
138
-
139
-
140
-
141
-
142
-
143
-
144
-
 145
145 -
 146
146 -
 147
147 -
 148
148 -
 149
149 -
 150
150 -
 151
151 -
 152
152 -
 153
153 -
 154
154 -
 155
155 -
 156
156 -
 157
157 -
 158
158 -
 159
159 -
 160
160 -
 161
161 -
 162
162 -
 163
163 -
 164
164 -
 165
165 -
166
-
167
-
168
-
169
-
170
-
171
-
172
-
173
-
174
-
175
-
176
-
177
-
178
-
179
-
180
-
181
-
182
-
183
-
184
-
185
-
186
-
187
-
188
-
189
-
190
-
191
-
192
-
193
-
194
-
195
-
196
-
197
-
198
-
199
-
200
-
201
-
202
-
203
-
204
-
205
-
206
-
207
-
208
-
209
-
210
-
211
-
212
-
213
-
214
-
215
-
216
-
217
-
218
-
219
-
220
-
221
-
222
-
223
-
224
-
225
-
226
-
227
-
228
-
229
-
230
-
231
-
232
-
233
-
234
-
235
-
236
-
237
-
238
-
239
-
240
-
241
-
242
-
243
-
244
-
245
-
246
-
247
-
248
-
249
-
250
-
251
-
252
-
253
-
254
-
255
-
256
-
257
-
258
-
259
-
260
-
261
-
262
-
263
-
264
-
265
-
266
-
267
-
268
-
269
-
270
-
271
-
272
-
273
-
274
-
275
-
276
-
277
-
278
-
279
-
280
-
281
-
282
-
283
-
284
-
285
-
286
-
287
-
288
-
289
-
290
-
291
-
292
-
293
-
294
-
295
-
296
-
297
-
298
-
299
-
300
-
301
-
302
 |
 |

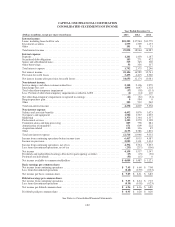
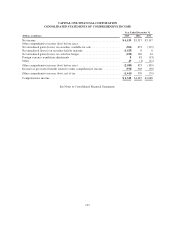
CAPITAL ONE FINANCIAL CORPORATION
CONSOLIDATED STATEMENTS OF CHANGES IN STOCKHOLDERS’ EQUITY
(Dollars in millions, except per share data)
Preferred Stock Common Stock Additional
Paid-In
Capital
Retained
Earnings
Accumulated
Other
Comprehensive
Income (Loss)
Treasury
Stock
Total
Stockholders’
EquityShares Amount Shares Amount
Balance as of December 31, 2010 ...... 0 $0 504,801,064 $5 $19,084 $10,406 $ 248 $(3,202) $26,541
Comprehensive income (loss) .......... 3,147 (79) 3,068
Cash dividends—common stock $0.20 per
share ............................ (91) (91)
Purchases of treasury stock ............. (42) (42)
Issuances of common stock and restricted
stock, net of forfeitures .............. 2,606,736 40 40
Exercise of stock options and tax benefits
of exercises and restricted stock
vesting ........................... 1,186,508 57 57
Compensation expense for restricted stock
awards and stock options ............ 93 93
Balance as of December 31, 2011 ...... 0 $0 508,594,308 $5 $19,274 $13,462 $ 169 $(3,244) $29,666
Comprehensive income (loss) .......... 3,517 570 4,087
Cash dividends—common stock $0.20 per
share ............................ (111) (111)
Cash dividends—preferred stock 6% per
annum ........................... (15) (15)
Purchases of treasury stock ............. (43) (43)
Issuances of common stock and restricted
stock, net of forfeitures .............. 67,368,854 3,233 3,233
Issuance of common stock related to
acquisition ........................ 54,028,086 1 2,637 2,638
Exercise of stock options and tax benefits
of exercises and restricted stock
vesting ........................... 1,815,337 80 80
Issuance of preferred stock ............. 875,000 853 853
Compensation expense for restricted stock
awards and stock options ............ 111 111
Balance as of December 31, 2012 ...... 875,000 $0 631,806,585 $6 $26,188 $16,853 $ 739 $(3,287) $40,499
Comprehensive income (loss) .......... 4,159 (1,611) 2,548
Cash dividends—common stock $0.95 per
share ............................ (555) (555)
Cash dividends—preferred stock 6% per
annum ........................... (53) (53)
Purchases of treasury stock ............. (1,033) (1,033)
Issuances of common stock and restricted
stock, net of forfeitures .............. 3,049,705 81 81
Exercise of stock options and tax benefits
of exercises and restricted stock
vesting ........................... 2,295,510 114 114
Compensation expense for restricted stock
awards and stock options ............ 143 143
Balance as of December 31, 2013 ...... 875,000 $0 637,151,800 $6 $26,526 $20,404 $ (872) $(4,320) $41,744
See Notes to Consolidated Financial Statements.
135