Capital One 2013 Annual Report Download - page 117
Download and view the complete annual report
Please find page 117 of the 2013 Capital One annual report below. You can navigate through the pages in the report by either clicking on the pages listed below, or by using the keyword search tool below to find specific information within the annual report.-
 1
1 -
2
-
3
-
4
-
5
-
6
-
7
-
8
-
9
-
10
-
11
-
12
-
13
-
14
-
15
-
16
-
17
-
18
-
19
-
20
-
21
-
22
-
23
-
24
-
25
-
26
-
27
-
28
-
29
-
30
-
31
-
32
-
33
-
34
-
35
-
36
-
37
-
38
-
39
-
40
-
41
-
42
-
43
-
44
-
45
-
46
-
47
-
48
-
49
-
50
-
51
-
52
-
53
-
54
-
55
-
56
-
57
-
58
-
59
-
60
-
61
-
62
-
63
-
64
-
65
-
66
-
67
-
68
-
69
-
70
-
71
-
72
-
73
-
74
-
75
-
76
-
77
-
78
-
79
-
80
-
81
-
82
-
83
-
84
-
85
-
86
-
87
-
88
-
89
-
90
-
91
-
92
-
93
-
94
-
95
-
96
-
97
-
98
-
99
-
100
-
101
-
102
-
103
-
104
-
105
-
106
-
 107
107 -
 108
108 -
 109
109 -
 110
110 -
 111
111 -
 112
112 -
 113
113 -
 114
114 -
 115
115 -
 116
116 -
 117
117 -
 118
118 -
 119
119 -
 120
120 -
 121
121 -
 122
122 -
 123
123 -
 124
124 -
 125
125 -
 126
126 -
 127
127 -
128
-
129
-
130
-
131
-
132
-
133
-
134
-
135
-
136
-
137
-
138
-
139
-
140
-
141
-
142
-
143
-
144
-
145
-
146
-
147
-
148
-
149
-
150
-
151
-
152
-
153
-
154
-
155
-
156
-
157
-
158
-
159
-
160
-
161
-
162
-
163
-
164
-
165
-
166
-
167
-
168
-
169
-
170
-
171
-
172
-
173
-
174
-
175
-
176
-
177
-
178
-
179
-
180
-
181
-
182
-
183
-
184
-
185
-
186
-
187
-
188
-
189
-
190
-
191
-
192
-
193
-
194
-
195
-
196
-
197
-
198
-
199
-
200
-
201
-
202
-
203
-
204
-
205
-
206
-
207
-
208
-
209
-
210
-
211
-
212
-
213
-
214
-
215
-
216
-
217
-
218
-
219
-
220
-
221
-
222
-
223
-
224
-
225
-
226
-
227
-
228
-
229
-
230
-
231
-
232
-
233
-
234
-
235
-
236
-
237
-
238
-
239
-
240
-
241
-
242
-
243
-
244
-
245
-
246
-
247
-
248
-
249
-
250
-
251
-
252
-
253
-
254
-
255
-
256
-
257
-
258
-
259
-
260
-
261
-
262
-
263
-
264
-
265
-
266
-
267
-
268
-
269
-
270
-
271
-
272
-
273
-
274
-
275
-
276
-
277
-
278
-
279
-
280
-
281
-
282
-
283
-
284
-
285
-
286
-
287
-
288
-
289
-
290
-
291
-
292
-
293
-
294
-
295
-
296
-
297
-
298
-
299
-
300
-
301
-
302
 |
 |

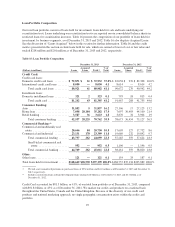
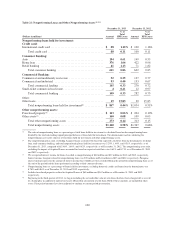
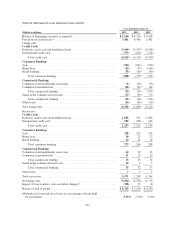
(1) Due to the revolving nature of credit card loans, we report majority of our variable-rate credit card loans as due in one year or less. We
report fixed-rate credit card loans with introductory rates that expire after a certain period of time as due in one year or less. We assume
that the rest of our remaining fixed-rate credit card loans will mature within one to three years.
(2) Includes installment loans of $323 million as of December 31, 2013.
(3) We report the maturity period for the home loans portfolio included in the Consumer Banking business based on the earlier of the next
re-pricing or contractual maturity date of the loan.
Credit Risk Measurement
We closely monitor economic conditions and loan performance trends to assess and manage our exposure to
credit risk. Key metrics we track in evaluating the credit quality of our loan portfolio include delinquency and
nonperforming asset rates, as well as charge-off rates and our internal risk ratings of larger balance commercial
loans. Trends in delinquency rates are a primary indicator of credit risk within our consumer loan portfolios, as
changes in delinquency rate provide an early warning of changes in credit losses. The primary indicator of credit
risk in our commercial loan portfolios is risk ratings. Because we generally classify loans that have been
delinquent for an extended period of time and other loans with significant risk of loss as nonperforming, the level
of nonperforming assets represents another indicator of the potential for future credit losses. In addition to
delinquency rates, the geographic distribution of our loans provides insight as to the credit quality of the portfolio
based on regional economic conditions.
We use borrower credit scores in underwriting for most consumer loans. We do not use credit scores as a primary
indicator of credit quality because product differences, loan structure, and other factors drive large differences in
credit quality for a given credit score. We continuously adjust our management of credit lines and collection
strategies based on customer behavior and risk profile changes.
As noted above, our Credit Card business accounted for $81.3 billion, or 41%, of our total loan portfolio as of
December 31, 2013, with Domestic Card accounting for $73.3 billion, or 37%, of our total loan portfolio as of
December 31, 2013. In comparison, our Credit Card business accounted for $91.8 billion, or 45%, of our total
loan portfolio as of December 31, 2012, with Domestic Card accounting for $83.1 billion, or 40%, of our total
loan portfolio as of December 31, 2012. Based on our most recent data, we estimate that approximately one-third
of our Domestic Card portfolio had credit scores equal or below 660 or no score, based on loan balances, as of
December 31, 2013, relatively consistent with the proportion of the Domestic Card portfolio with credit scores
equal or below 660 or no score as of December 31, 2012.
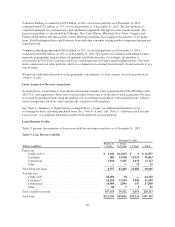
We present information in the table below on the credit performance of our loan portfolio, including the key
metrics we use in tracking changes in the credit quality of our loan portfolio. We also present adjusted credit
quality metrics excluding impact from Acquired Loans that are accounted for based on estimated cash flows.
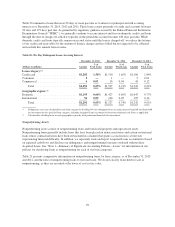
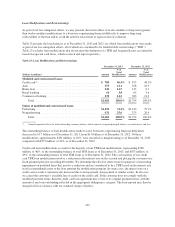
Delinquency Rates
We consider the entire balance of an account to be delinquent if the minimum required payment is not received
by the first statement cycle date equal to or following the due date specified on the customer’s billing statement.
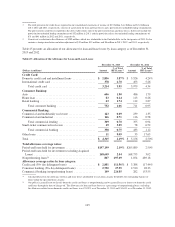
Table 18 compares 30+ day performing and total 30+ day delinquency rates, by loan category, as of
December 31, 2013 and 2012. Table 18 also presents these metrics adjusted to exclude from the denominator
Acquired Loans accounted for based on estimated cash flows expected to be collected over the life of the loans.
Our 30+ day delinquency metrics include all held for investment loans that are 30 or more days past due, whereas
our 30+ day performing delinquency metrics include loans that are 30 or more days past due and that are also
currently classified as performing and accruing interest. The 30+ day delinquency and 30+ day performing
delinquency metrics are generally the same for credit card loans, as we continue to classify the substantial
majority of credit card loans as performing until the account is charged-off, typically when the account is 180
days past due. See “Note 1—Summary of Significant Accounting Policies—Loans” for information on our
policies for classifying loans as nonperforming for each of our loan categories.
97