Capital One 2013 Annual Report Download - page 187
Download and view the complete annual report
Please find page 187 of the 2013 Capital One annual report below. You can navigate through the pages in the report by either clicking on the pages listed below, or by using the keyword search tool below to find specific information within the annual report.-
 1
1 -
2
-
3
-
4
-
5
-
6
-
7
-
8
-
9
-
10
-
11
-
12
-
13
-
14
-
15
-
16
-
17
-
18
-
19
-
20
-
21
-
22
-
23
-
24
-
25
-
26
-
27
-
28
-
29
-
30
-
31
-
32
-
33
-
34
-
35
-
36
-
37
-
38
-
39
-
40
-
41
-
42
-
43
-
44
-
45
-
46
-
47
-
48
-
49
-
50
-
51
-
52
-
53
-
54
-
55
-
56
-
57
-
58
-
59
-
60
-
61
-
62
-
63
-
64
-
65
-
66
-
67
-
68
-
69
-
70
-
71
-
72
-
73
-
74
-
75
-
76
-
77
-
78
-
79
-
80
-
81
-
82
-
83
-
84
-
85
-
86
-
87
-
88
-
89
-
90
-
91
-
92
-
93
-
94
-
95
-
96
-
97
-
98
-
99
-
100
-
101
-
102
-
103
-
104
-
105
-
106
-
107
-
108
-
109
-
110
-
111
-
112
-
113
-
114
-
115
-
116
-
117
-
118
-
119
-
120
-
121
-
122
-
123
-
124
-
125
-
126
-
127
-
128
-
129
-
130
-
131
-
132
-
133
-
134
-
135
-
136
-
137
-
138
-
139
-
140
-
141
-
142
-
143
-
144
-
145
-
146
-
147
-
148
-
149
-
150
-
151
-
152
-
153
-
154
-
155
-
156
-
157
-
158
-
159
-
160
-
161
-
162
-
163
-
164
-
165
-
166
-
167
-
168
-
169
-
170
-
171
-
172
-
173
-
174
-
175
-
176
-
 177
177 -
 178
178 -
 179
179 -
 180
180 -
 181
181 -
 182
182 -
 183
183 -
 184
184 -
 185
185 -
 186
186 -
 187
187 -
 188
188 -
 189
189 -
 190
190 -
 191
191 -
 192
192 -
 193
193 -
 194
194 -
 195
195 -
 196
196 -
 197
197 -
198
-
199
-
200
-
201
-
202
-
203
-
204
-
205
-
206
-
207
-
208
-
209
-
210
-
211
-
212
-
213
-
214
-
215
-
216
-
217
-
218
-
219
-
220
-
221
-
222
-
223
-
224
-
225
-
226
-
227
-
228
-
229
-
230
-
231
-
232
-
233
-
234
-
235
-
236
-
237
-
238
-
239
-
240
-
241
-
242
-
243
-
244
-
245
-
246
-
247
-
248
-
249
-
250
-
251
-
252
-
253
-
254
-
255
-
256
-
257
-
258
-
259
-
260
-
261
-
262
-
263
-
264
-
265
-
266
-
267
-
268
-
269
-
270
-
271
-
272
-
273
-
274
-
275
-
276
-
277
-
278
-
279
-
280
-
281
-
282
-
283
-
284
-
285
-
286
-
287
-
288
-
289
-
290
-
291
-
292
-
293
-
294
-
295
-
296
-
297
-
298
-
299
-
300
-
301
-
302
 |
 |

CAPITAL ONE FINANCIAL CORPORATION
NOTES TO CONSOLIDATED FINANCIAL STATEMENTS—(Continued)
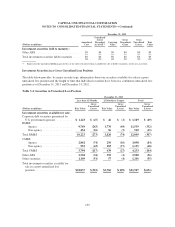
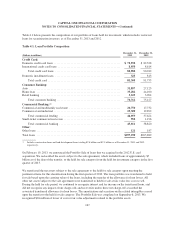
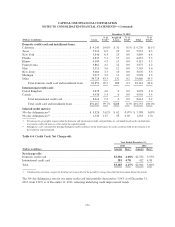
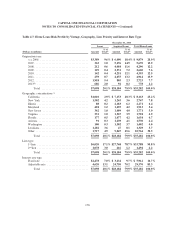
Table 4.1 below presents the composition of our portfolio of loans held for investment, which includes restricted
loans for securitization investors, as of December 31, 2013 and 2012.
Table 4.1: Loan Portfolio Composition
(Dollars in millions)
December 31,
2013
December 31,
2012
Credit Card:
Domestic credit card loans ............................................... $ 72,932 $ 82,328
International credit card loans ............................................ 8,050 8,614
Total credit card loans .............................................. 80,982 90,942
Domestic installment loans .............................................. 323 813
Total credit card ................................................... 81,305 91,755
Consumer Banking:
Auto ................................................................ 31,857 27,123
Home loan ........................................................... 35,282 44,100
Retail banking ........................................................ 3,623 3,904
Total consumer banking ............................................. 70,762 75,127
Commercial Banking:(1)
Commercial and multifamily real estate .................................... 20,750 17,732
Commercial and industrial ............................................... 23,309 19,892
Total commercial lending ........................................... 44,059 37,624
Small-ticket commercial real estate ........................................ 952 1,196
Total commercial banking ........................................... 45,011 38,820
Other:
Other loans ........................................................... 121 187
Total loans ........................................................... $197,199 $205,889
(1) Includes construction loans and land development loans totaling $2.0 billion and $2.1 billion as of December 31, 2013 and 2012,
respectively.
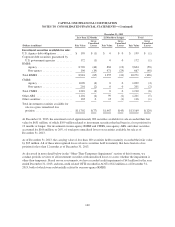
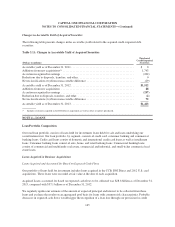
On February 19, 2013, we announced the Portfolio Sale of loans that we acquired in the 2012 U.S. card
acquisition. We reclassified the assets subject to the sale agreement, which included loans of approximately $7
billion as of the date of the transfer, to the held for sale category from the held for investment category in the first
quarter of 2013.
We transferred the net assets subject to the sale agreement to the held for sale category upon meeting the
pertinent criteria for this classification during the first quarter of 2013. The loan portfolio was transferred to held
for sale based upon the carrying value of the loans, including the transfer of the allowance for loan losses. All
other net assets subject to the sale agreement were transferred to held for sale at fair value less costs to sell.
During the held for sale period, we continued to recognize interest and fee income on the transferred loans, and
did not recognize any impacts from charge-offs and recoveries unless these net charge-offs exceeded the
associated transferred allowance for loan losses. The amortization and accretion on the related intangibles ceased
upon the transfer to the held for sale category. The Portfolio Sale was completed on September 6, 2013. We
recognized $26 million of lower of cost or fair value adjustments related to the portfolio assets.
167