Capital One 2013 Annual Report Download - page 247
Download and view the complete annual report
Please find page 247 of the 2013 Capital One annual report below. You can navigate through the pages in the report by either clicking on the pages listed below, or by using the keyword search tool below to find specific information within the annual report.-
 1
1 -
2
-
3
-
4
-
5
-
6
-
7
-
8
-
9
-
10
-
11
-
12
-
13
-
14
-
15
-
16
-
17
-
18
-
19
-
20
-
21
-
22
-
23
-
24
-
25
-
26
-
27
-
28
-
29
-
30
-
31
-
32
-
33
-
34
-
35
-
36
-
37
-
38
-
39
-
40
-
41
-
42
-
43
-
44
-
45
-
46
-
47
-
48
-
49
-
50
-
51
-
52
-
53
-
54
-
55
-
56
-
57
-
58
-
59
-
60
-
61
-
62
-
63
-
64
-
65
-
66
-
67
-
68
-
69
-
70
-
71
-
72
-
73
-
74
-
75
-
76
-
77
-
78
-
79
-
80
-
81
-
82
-
83
-
84
-
85
-
86
-
87
-
88
-
89
-
90
-
91
-
92
-
93
-
94
-
95
-
96
-
97
-
98
-
99
-
100
-
101
-
102
-
103
-
104
-
105
-
106
-
107
-
108
-
109
-
110
-
111
-
112
-
113
-
114
-
115
-
116
-
117
-
118
-
119
-
120
-
121
-
122
-
123
-
124
-
125
-
126
-
127
-
128
-
129
-
130
-
131
-
132
-
133
-
134
-
135
-
136
-
137
-
138
-
139
-
140
-
141
-
142
-
143
-
144
-
145
-
146
-
147
-
148
-
149
-
150
-
151
-
152
-
153
-
154
-
155
-
156
-
157
-
158
-
159
-
160
-
161
-
162
-
163
-
164
-
165
-
166
-
167
-
168
-
169
-
170
-
171
-
172
-
173
-
174
-
175
-
176
-
177
-
178
-
179
-
180
-
181
-
182
-
183
-
184
-
185
-
186
-
187
-
188
-
189
-
190
-
191
-
192
-
193
-
194
-
195
-
196
-
197
-
198
-
199
-
200
-
201
-
202
-
203
-
204
-
205
-
206
-
207
-
208
-
209
-
210
-
211
-
212
-
213
-
214
-
215
-
216
-
217
-
218
-
219
-
220
-
221
-
222
-
223
-
224
-
225
-
226
-
227
-
228
-
229
-
230
-
231
-
232
-
233
-
234
-
235
-
236
-
 237
237 -
 238
238 -
 239
239 -
 240
240 -
 241
241 -
 242
242 -
 243
243 -
 244
244 -
 245
245 -
 246
246 -
 247
247 -
 248
248 -
 249
249 -
 250
250 -
 251
251 -
 252
252 -
 253
253 -
 254
254 -
 255
255 -
 256
256 -
 257
257 -
258
-
259
-
260
-
261
-
262
-
263
-
264
-
265
-
266
-
267
-
268
-
269
-
270
-
271
-
272
-
273
-
274
-
275
-
276
-
277
-
278
-
279
-
280
-
281
-
282
-
283
-
284
-
285
-
286
-
287
-
288
-
289
-
290
-
291
-
292
-
293
-
294
-
295
-
296
-
297
-
298
-
299
-
300
-
301
-
302
 |
 |

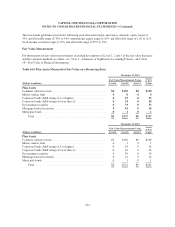
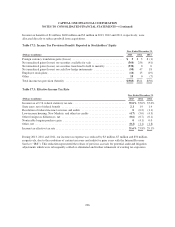
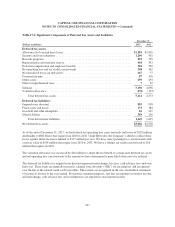
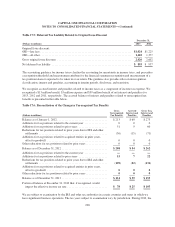
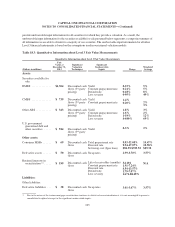
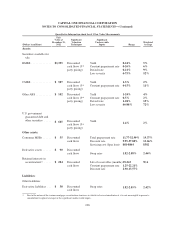
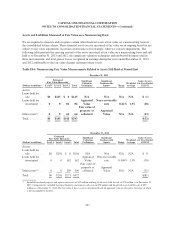
CAPITAL ONE FINANCIAL CORPORATION
NOTES TO CONSOLIDATED FINANCIAL STATEMENTS—(Continued)
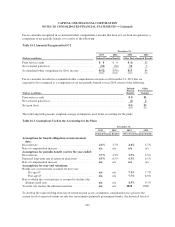
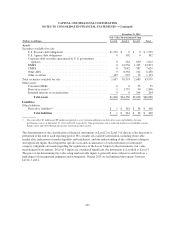
Table 17.4: Significant Components of Deferred Tax Assets and Liabilities
December 31,
(Dollars in millions) 2013 2012
Deferred tax assets:
Allowance for loan and lease losses ............................................... $1,583 $1,876
Security and loan valuations ..................................................... 1,296 502
Rewards programs ............................................................. 855 755
Representation and warranty reserve .............................................. 444 343
Deferred compensation and employee benefits ...................................... 304 350
Net operating loss and tax credit carryforwards ...................................... 248 362
Net unrealized losses on derivatives ............................................... 167 77
Unearned income .............................................................. 87 116
Other assets .................................................................. 259 293
Other foreign deferred taxes ..................................................... 722
Subtotal ..................................................................... 5,250 4,696
Valuation allowance ........................................................... (139) (123)
Total deferred tax assets .................................................... 5,111 4,573
Deferred tax liabilities:
Original issue discount ......................................................... 893 958
Fixed assets and leases ......................................................... 173 184
Goodwill and other intangibles ................................................... 10 237
Other liabilities ............................................................... 369 256
Total deferred tax liabilities ................................................. 1,445 1,635
Net deferred tax assets .......................................................... $3,666 $2,938
As of the end of December 31, 2013, we had federal net operating loss carry-forwards and losses of $252 million
attributable to ING Direct that expire from 2018 to 2032. Under IRS rules, the Company’s ability to utilize these
losses against future income is limited to $317 million per year. We have state operating loss carryforwards with
a net tax value of $144 million that expire from 2014 to 2033. We have a foreign tax credit carryforward of $16
million that expires in 2019.
The valuation allowance was increased by $16 million to adjust the tax benefit of certain state deferred tax assets
and net operating loss carryforwards to the amount we have determined is more likely than not to be realized.
The deferred tax liability for original issue discount represents interchange, late fees, cash advance fees and over-
limit fees. These items are generally treated as original issue discount (“OID”) for tax purposes and recognized
over the life of the related credit card receivables. These items are recognized in the our consolidated statements
of income as income in the year earned. For income statement purposes, late fees are reported as interest income,
and interchange, cash advance fees and overlimit fees are reported as non-interest income.
227