Capital One 2013 Annual Report Download - page 60
Download and view the complete annual report
Please find page 60 of the 2013 Capital One annual report below. You can navigate through the pages in the report by either clicking on the pages listed below, or by using the keyword search tool below to find specific information within the annual report.-
 1
1 -
2
-
3
-
4
-
5
-
6
-
7
-
8
-
9
-
10
-
11
-
12
-
13
-
14
-
15
-
16
-
17
-
18
-
19
-
20
-
21
-
22
-
23
-
24
-
25
-
26
-
27
-
28
-
29
-
30
-
31
-
32
-
33
-
34
-
35
-
36
-
37
-
38
-
39
-
40
-
41
-
42
-
43
-
44
-
45
-
46
-
47
-
48
-
49
-
 50
50 -
 51
51 -
 52
52 -
 53
53 -
 54
54 -
 55
55 -
 56
56 -
 57
57 -
 58
58 -
 59
59 -
 60
60 -
 61
61 -
 62
62 -
 63
63 -
 64
64 -
 65
65 -
 66
66 -
 67
67 -
 68
68 -
 69
69 -
 70
70 -
71
-
72
-
73
-
74
-
75
-
76
-
77
-
78
-
79
-
80
-
81
-
82
-
83
-
84
-
85
-
86
-
87
-
88
-
89
-
90
-
91
-
92
-
93
-
94
-
95
-
96
-
97
-
98
-
99
-
100
-
101
-
102
-
103
-
104
-
105
-
106
-
107
-
108
-
109
-
110
-
111
-
112
-
113
-
114
-
115
-
116
-
117
-
118
-
119
-
120
-
121
-
122
-
123
-
124
-
125
-
126
-
127
-
128
-
129
-
130
-
131
-
132
-
133
-
134
-
135
-
136
-
137
-
138
-
139
-
140
-
141
-
142
-
143
-
144
-
145
-
146
-
147
-
148
-
149
-
150
-
151
-
152
-
153
-
154
-
155
-
156
-
157
-
158
-
159
-
160
-
161
-
162
-
163
-
164
-
165
-
166
-
167
-
168
-
169
-
170
-
171
-
172
-
173
-
174
-
175
-
176
-
177
-
178
-
179
-
180
-
181
-
182
-
183
-
184
-
185
-
186
-
187
-
188
-
189
-
190
-
191
-
192
-
193
-
194
-
195
-
196
-
197
-
198
-
199
-
200
-
201
-
202
-
203
-
204
-
205
-
206
-
207
-
208
-
209
-
210
-
211
-
212
-
213
-
214
-
215
-
216
-
217
-
218
-
219
-
220
-
221
-
222
-
223
-
224
-
225
-
226
-
227
-
228
-
229
-
230
-
231
-
232
-
233
-
234
-
235
-
236
-
237
-
238
-
239
-
240
-
241
-
242
-
243
-
244
-
245
-
246
-
247
-
248
-
249
-
250
-
251
-
252
-
253
-
254
-
255
-
256
-
257
-
258
-
259
-
260
-
261
-
262
-
263
-
264
-
265
-
266
-
267
-
268
-
269
-
270
-
271
-
272
-
273
-
274
-
275
-
276
-
277
-
278
-
279
-
280
-
281
-
282
-
283
-
284
-
285
-
286
-
287
-
288
-
289
-
290
-
291
-
292
-
293
-
294
-
295
-
296
-
297
-
298
-
299
-
300
-
301
-
302
 |
 |

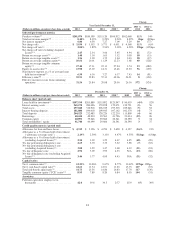
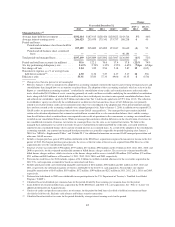
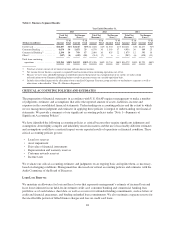
Five-Year Summary of Selected Financial Data
Change
Year Ended December 31, 2013 vs.
2012
2012 vs.
2011(Dollars in millions, except per share data as noted) 2013 2012 2011 2010(1) 2009
Income statement
Interest income ........................... $ 19,898 $ 18,964 $ 14,987 $ 15,353 $ 10,664 5% 27%
Interest expense .......................... 1,792 2,375 2,246 2,896 2,967 (25) 6
Net interest income ........................ 18,106 16,589 12,741 12,457 7,697 930
Non-interest income(2) ..................... 4,278 4,807 3,538 3,714 5,286 (11) 36
Total net revenue(3) ........................ 22,384 21,396 16,279 16,171 12,983 531
Provision for credit losses(4) ................. 3,453 4,415 2,360 3,907 4,230 (22) 87
Non-interest expense(5) ..................... 12,514 11,946 9,332 7,934 7,417 528
Income from continuing operations before
income taxes ........................... 6,417 5,035 4,587 4,330 1,336 27 10
Income tax provision ...................... 2,025 1,301 1,334 1,280 349 56 (2)
Income from continuing operations, net of tax . . 4,392 3,734 3,253 3,050 987 18 15
Loss from discontinued operations, net of tax . . . (233) (217) (106) (307) (103) (7) (105)
Net income .............................. 4,159 3,517 3,147 2,743 884 18 12
Dividends and undistributed earnings allocated to
participating securities ................... (17) (15) (26) — — (13) 42
Preferred stock dividends(6) ................. (53) (15) — — (564) (253) **
Net income available to common shareholders . . $ 4,089 $ 3,487 $ 3,121 $ 2,743 $ 320 17% 12%
Common share statistics
Basic earnings per common share:
Net income from continuing operations ........ $ 7.45 $ 6.60 $ 7.08 $ 6.74 $ 0.99 13% (7)%
Loss from discontinued operations ............ (0.40) (0.39) (0.23) (0.67) (0.24) (3) (70)
Net income (loss) per common share. . ........ $ 7.05 $ 6.21 $ 6.85 $ 6.07 $ 0.75 14% (9)%
Diluted earnings per common share:
Net income from continuing operations ........ $ 7.35 $ 6.54 $ 7.03 $ 6.68 $ 0.98 12% (7)%
Loss from discontinued operations ............ (0.39) (0.38) (0.23) (0.67) (0.24) (3) (65)
Net income (loss) per common share. . ........ $ 6.96 $ 6.16 $ 6.80 $ 6.01 $ 0.74 13% (9)%
Dividends per common share. ............... $ 0.95 $ 0.20 $ 0.20 $ 0.20 $ 0.53 375% —%
Common dividend payout ratio(7) ............. 13.48% 3.22% 2.92% 3.29% 70.67% 1,026bps 30bps
Stock price per common share at period end. .... $ 76.61 $ 57.93 $ 42.29 $ 42.56 $ 38.34 32% 37%
Book value per common share at period end. . . . 72.89 69.56 64.51 58.62 59.04 58
Total market capitalization at period end ....... 43,875 33,727 19,301 19,271 17,268 30 75
Average balances
Loans held for investment(8) ................. $192,614 $187,915 $128,424 $128,526 $ 99,787 3% 46%
Interest-earning assets ..................... 266,423 255,079 175,265 175,683 145,552 446
Total assets .............................. 297,284 286,602 199,718 200,114 171,598 444
Interest-bearing deposits .................... 187,700 183,314 109,644 104,743 103,078 267
Total deposits ............................ 209,045 203,055 126,694 119,010 115,601 360
Borrowings .............................. 37,807 38,025 38,022 49,620 23,522 (1) **
Common equity .......................... 40,722 36,996 28,579 24,941 25,177 10 29
Total stockholders’ equity .................. 41,575 37,327 28,579 24,941 26,606 11 31
40