Capital One 2013 Annual Report Download - page 178
Download and view the complete annual report
Please find page 178 of the 2013 Capital One annual report below. You can navigate through the pages in the report by either clicking on the pages listed below, or by using the keyword search tool below to find specific information within the annual report.-
 1
1 -
2
-
3
-
4
-
5
-
6
-
7
-
8
-
9
-
10
-
11
-
12
-
13
-
14
-
15
-
16
-
17
-
18
-
19
-
20
-
21
-
22
-
23
-
24
-
25
-
26
-
27
-
28
-
29
-
30
-
31
-
32
-
33
-
34
-
35
-
36
-
37
-
38
-
39
-
40
-
41
-
42
-
43
-
44
-
45
-
46
-
47
-
48
-
49
-
50
-
51
-
52
-
53
-
54
-
55
-
56
-
57
-
58
-
59
-
60
-
61
-
62
-
63
-
64
-
65
-
66
-
67
-
68
-
69
-
70
-
71
-
72
-
73
-
74
-
75
-
76
-
77
-
78
-
79
-
80
-
81
-
82
-
83
-
84
-
85
-
86
-
87
-
88
-
89
-
90
-
91
-
92
-
93
-
94
-
95
-
96
-
97
-
98
-
99
-
100
-
101
-
102
-
103
-
104
-
105
-
106
-
107
-
108
-
109
-
110
-
111
-
112
-
113
-
114
-
115
-
116
-
117
-
118
-
119
-
120
-
121
-
122
-
123
-
124
-
125
-
126
-
127
-
128
-
129
-
130
-
131
-
132
-
133
-
134
-
135
-
136
-
137
-
138
-
139
-
140
-
141
-
142
-
143
-
144
-
145
-
146
-
147
-
148
-
149
-
150
-
151
-
152
-
153
-
154
-
155
-
156
-
157
-
158
-
159
-
160
-
161
-
162
-
163
-
164
-
165
-
166
-
167
-
 168
168 -
 169
169 -
 170
170 -
 171
171 -
 172
172 -
 173
173 -
 174
174 -
 175
175 -
 176
176 -
 177
177 -
 178
178 -
 179
179 -
 180
180 -
 181
181 -
 182
182 -
 183
183 -
 184
184 -
 185
185 -
 186
186 -
 187
187 -
 188
188 -
189
-
190
-
191
-
192
-
193
-
194
-
195
-
196
-
197
-
198
-
199
-
200
-
201
-
202
-
203
-
204
-
205
-
206
-
207
-
208
-
209
-
210
-
211
-
212
-
213
-
214
-
215
-
216
-
217
-
218
-
219
-
220
-
221
-
222
-
223
-
224
-
225
-
226
-
227
-
228
-
229
-
230
-
231
-
232
-
233
-
234
-
235
-
236
-
237
-
238
-
239
-
240
-
241
-
242
-
243
-
244
-
245
-
246
-
247
-
248
-
249
-
250
-
251
-
252
-
253
-
254
-
255
-
256
-
257
-
258
-
259
-
260
-
261
-
262
-
263
-
264
-
265
-
266
-
267
-
268
-
269
-
270
-
271
-
272
-
273
-
274
-
275
-
276
-
277
-
278
-
279
-
280
-
281
-
282
-
283
-
284
-
285
-
286
-
287
-
288
-
289
-
290
-
291
-
292
-
293
-
294
-
295
-
296
-
297
-
298
-
299
-
300
-
301
-
302
 |
 |

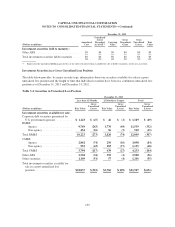
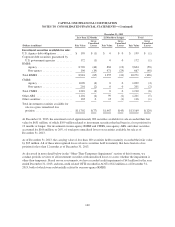
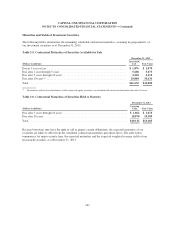
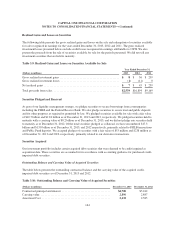
CAPITAL ONE FINANCIAL CORPORATION
NOTES TO CONSOLIDATED FINANCIAL STATEMENTS—(Continued)
December 31, 2012
(Dollars in millions)
Amortized
Cost
Gross
Unrealized
Gains
Gross
Unrealized
Losses(1)
Fair
Value
Investment securities available for sale:
U.S. Treasury debt obligations ............................. $ 1,548 $ 4 $ 0 $ 1,552
U.S. Agency debt obligations .............................. 301 2 (1) 302
Corporate debt securities guaranteed by U.S. government
agencies ............................................. 1,003 10 (1) 1,012
RMBS:
Agency ............................................ 39,408 652 (58) 40,002
Non-agency ........................................ 3,607 312 (48) 3,871
Total RMBS ............................................ 43,015 964 (106) 43,873
CMBS:
Agency ............................................ 6,045 103 (4) 6,144
Non-agency ........................................ 1,425 62 (2) 1,485
Total CMBS ............................................ 7,470 165 (6) 7,629
Other ABS(2) ............................................ 8,393 70 (5) 8,458
Other securities(3) ........................................ 1,120 34 (1) 1,153
Total investment securities available for sale .................. $62,850 $1,249 $(120) $63,979
(1) Includes non-credit related OTTI losses recorded in AOCI of $12 million and $38 million as of December 31, 2013 and 2012,
respectively, substantially all of which is related to non-agency RMBS.
(2) The ABS collateralized by credit card loans constituted approximately 65% and 64% of the other ABS portfolio as of December 31,
2013, and 2012, respectively, and ABS collateralized by auto dealer floor plan inventory loans and leases constituted approximately 15%
and 18% of the other ABS portfolio as of December 31, 2013, and 2012, respectively. Approximately 87% of the securities in our other
asset-backed security portfolio were rated AAA or its equivalent as of December 31, 2013, compared with 82% as of December 31,
2012.
(3) Includes foreign government/agency bonds, covered bonds, corporate securities, municipal securities and equity investments primarily
related to activities under the Community Reinvestment Act (“CRA”).
The table below presents the carrying value, gross unrealized gains and losses, and fair value of securities held to
maturity at December 31, 2013 and 2012.
Table 3.3 Investment Securities Held to Maturity
December 31, 2013
(Dollars in millions)
Amortized
Cost
Unrealized
Losses
Recorded
in AOCI(1)
Carrying
Value
Gross
Unrealized
Gains
Gross
Unrealized
Losses
Fair
Value
Investment securities held to maturity:
RMBS
Agency .......................... $18,746 $(1,303) $17,443 $72 $(30) $17,485
CMBS
Agency .......................... 1,821 (132) 1,689 16 (5) 1,700
Total investment securities held to
maturity ........................... $20,567 $(1,435) $19,132 $88 $(35) $19,185
158