Capital One 2013 Annual Report Download - page 200
Download and view the complete annual report
Please find page 200 of the 2013 Capital One annual report below. You can navigate through the pages in the report by either clicking on the pages listed below, or by using the keyword search tool below to find specific information within the annual report.-
 1
1 -
2
-
3
-
4
-
5
-
6
-
7
-
8
-
9
-
10
-
11
-
12
-
13
-
14
-
15
-
16
-
17
-
18
-
19
-
20
-
21
-
22
-
23
-
24
-
25
-
26
-
27
-
28
-
29
-
30
-
31
-
32
-
33
-
34
-
35
-
36
-
37
-
38
-
39
-
40
-
41
-
42
-
43
-
44
-
45
-
46
-
47
-
48
-
49
-
50
-
51
-
52
-
53
-
54
-
55
-
56
-
57
-
58
-
59
-
60
-
61
-
62
-
63
-
64
-
65
-
66
-
67
-
68
-
69
-
70
-
71
-
72
-
73
-
74
-
75
-
76
-
77
-
78
-
79
-
80
-
81
-
82
-
83
-
84
-
85
-
86
-
87
-
88
-
89
-
90
-
91
-
92
-
93
-
94
-
95
-
96
-
97
-
98
-
99
-
100
-
101
-
102
-
103
-
104
-
105
-
106
-
107
-
108
-
109
-
110
-
111
-
112
-
113
-
114
-
115
-
116
-
117
-
118
-
119
-
120
-
121
-
122
-
123
-
124
-
125
-
126
-
127
-
128
-
129
-
130
-
131
-
132
-
133
-
134
-
135
-
136
-
137
-
138
-
139
-
140
-
141
-
142
-
143
-
144
-
145
-
146
-
147
-
148
-
149
-
150
-
151
-
152
-
153
-
154
-
155
-
156
-
157
-
158
-
159
-
160
-
161
-
162
-
163
-
164
-
165
-
166
-
167
-
168
-
169
-
170
-
171
-
172
-
173
-
174
-
175
-
176
-
177
-
178
-
179
-
180
-
181
-
182
-
183
-
184
-
185
-
186
-
187
-
188
-
189
-
 190
190 -
 191
191 -
 192
192 -
 193
193 -
 194
194 -
 195
195 -
 196
196 -
 197
197 -
 198
198 -
 199
199 -
 200
200 -
 201
201 -
 202
202 -
 203
203 -
 204
204 -
 205
205 -
 206
206 -
 207
207 -
 208
208 -
 209
209 -
 210
210 -
211
-
212
-
213
-
214
-
215
-
216
-
217
-
218
-
219
-
220
-
221
-
222
-
223
-
224
-
225
-
226
-
227
-
228
-
229
-
230
-
231
-
232
-
233
-
234
-
235
-
236
-
237
-
238
-
239
-
240
-
241
-
242
-
243
-
244
-
245
-
246
-
247
-
248
-
249
-
250
-
251
-
252
-
253
-
254
-
255
-
256
-
257
-
258
-
259
-
260
-
261
-
262
-
263
-
264
-
265
-
266
-
267
-
268
-
269
-
270
-
271
-
272
-
273
-
274
-
275
-
276
-
277
-
278
-
279
-
280
-
281
-
282
-
283
-
284
-
285
-
286
-
287
-
288
-
289
-
290
-
291
-
292
-
293
-
294
-
295
-
296
-
297
-
298
-
299
-
300
-
301
-
302
 |
 |

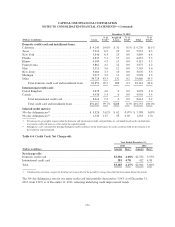
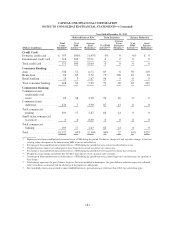
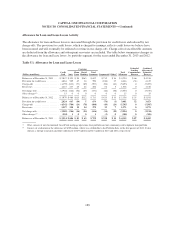
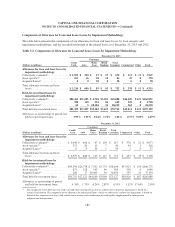
CAPITAL ONE FINANCIAL CORPORATION
NOTES TO CONSOLIDATED FINANCIAL STATEMENTS—(Continued)
December 31, 2012
(Dollars in millions)
Commercial
and
Multifamily
Real Estate
% of
Total(1)
Commercial
and
Industrial
% of
Total(1)
Small-ticket
Commercial
Real Estate
% of
Total(1)
Total
Commercial
% of
Total(1)
Geographic concentration:(2)
Loans:
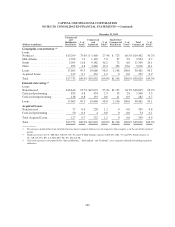
Northeast .................... $13,299 75.0% $ 5,460 27.4% $ 723 60.5% $19,482 50.2%
Mid-Atlantic ................. 1,398 7.9 1,149 5.8 47 3.9 2,594 6.7
South ....................... 2,055 11.6 9,182 46.2 72 6.0 11,309 29.1
Other ....................... 853 4.8 3,869 19.4 354 29.6 5,076 13.1
Loans ....................... 17,605 99.3 19,660 98.8 1,196 100.0 38,461 99.1
Acquired Loans . . . . . . . . . . . . . . . 127 0.7 232 1.2 0 0.0 359 0.9
Total ........................ $17,732 100.0% $19,892 100.0% $1,196 100.0% $38,820 100.0%
Internal risk rating:(3)
Loans:
Noncriticized ................. $16,614 93.7% $19,073 95.9% $1,152 96.3% $36,839 94.9%
Criticized performing . . . . . . . . . . . 853 4.8 454 2.3 33 2.8 1,340 3.5
Criticized nonperforming . . . . . . . . 138 0.8 133 0.6 11 0.9 282 0.7
Loans ....................... 17,605 99.3 19,660 98.8 1,196 100.0 38,461 99.1
Acquired Loans:
Noncriticized ................. 77 0.4 228 1.2 0 0.0 305 0.8
Criticized performing . . . . . . . . . . . 50 0.3 4 0.0 0 0.0 54 0.1
Total Acquired Loans . . . . . . . . . . 127 0.7 232 1.2 0 0.0 359 0.9
Total ........................ $17,732 100.0% $19,892 100.0% $1,196 100.0% $38,820 100.0%
(1) Percentages calculated based on total held-for-investment commercial loans in each respective loan category as of the end of the reported
period.
(2) Northeast consists of CT, ME, MA, NH, NJ, NY, PA and VT. Mid-Atlantic consists of DE, DC, MD, VA and WV. South consists of
AL, AR, FL, GA, KY, LA, MS, MO, NC, SC, TN and TX.
(3) Criticized exposures correspond to the “Special Mention,” “Substandard” and “Doubtful” asset categories defined by banking regulatory
authorities.
180