Capital One 2013 Annual Report Download - page 257
Download and view the complete annual report
Please find page 257 of the 2013 Capital One annual report below. You can navigate through the pages in the report by either clicking on the pages listed below, or by using the keyword search tool below to find specific information within the annual report.-
 1
1 -
2
-
3
-
4
-
5
-
6
-
7
-
8
-
9
-
10
-
11
-
12
-
13
-
14
-
15
-
16
-
17
-
18
-
19
-
20
-
21
-
22
-
23
-
24
-
25
-
26
-
27
-
28
-
29
-
30
-
31
-
32
-
33
-
34
-
35
-
36
-
37
-
38
-
39
-
40
-
41
-
42
-
43
-
44
-
45
-
46
-
47
-
48
-
49
-
50
-
51
-
52
-
53
-
54
-
55
-
56
-
57
-
58
-
59
-
60
-
61
-
62
-
63
-
64
-
65
-
66
-
67
-
68
-
69
-
70
-
71
-
72
-
73
-
74
-
75
-
76
-
77
-
78
-
79
-
80
-
81
-
82
-
83
-
84
-
85
-
86
-
87
-
88
-
89
-
90
-
91
-
92
-
93
-
94
-
95
-
96
-
97
-
98
-
99
-
100
-
101
-
102
-
103
-
104
-
105
-
106
-
107
-
108
-
109
-
110
-
111
-
112
-
113
-
114
-
115
-
116
-
117
-
118
-
119
-
120
-
121
-
122
-
123
-
124
-
125
-
126
-
127
-
128
-
129
-
130
-
131
-
132
-
133
-
134
-
135
-
136
-
137
-
138
-
139
-
140
-
141
-
142
-
143
-
144
-
145
-
146
-
147
-
148
-
149
-
150
-
151
-
152
-
153
-
154
-
155
-
156
-
157
-
158
-
159
-
160
-
161
-
162
-
163
-
164
-
165
-
166
-
167
-
168
-
169
-
170
-
171
-
172
-
173
-
174
-
175
-
176
-
177
-
178
-
179
-
180
-
181
-
182
-
183
-
184
-
185
-
186
-
187
-
188
-
189
-
190
-
191
-
192
-
193
-
194
-
195
-
196
-
197
-
198
-
199
-
200
-
201
-
202
-
203
-
204
-
205
-
206
-
207
-
208
-
209
-
210
-
211
-
212
-
213
-
214
-
215
-
216
-
217
-
218
-
219
-
220
-
221
-
222
-
223
-
224
-
225
-
226
-
227
-
228
-
229
-
230
-
231
-
232
-
233
-
234
-
235
-
236
-
237
-
238
-
239
-
240
-
241
-
242
-
243
-
244
-
245
-
246
-
 247
247 -
 248
248 -
 249
249 -
 250
250 -
 251
251 -
 252
252 -
 253
253 -
 254
254 -
 255
255 -
 256
256 -
 257
257 -
 258
258 -
 259
259 -
 260
260 -
 261
261 -
 262
262 -
 263
263 -
 264
264 -
 265
265 -
 266
266 -
 267
267 -
268
-
269
-
270
-
271
-
272
-
273
-
274
-
275
-
276
-
277
-
278
-
279
-
280
-
281
-
282
-
283
-
284
-
285
-
286
-
287
-
288
-
289
-
290
-
291
-
292
-
293
-
294
-
295
-
296
-
297
-
298
-
299
-
300
-
301
-
302
 |
 |

CAPITAL ONE FINANCIAL CORPORATION
NOTES TO CONSOLIDATED FINANCIAL STATEMENTS—(Continued)
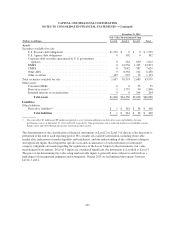
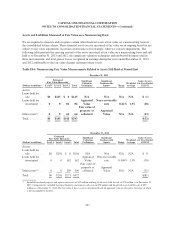
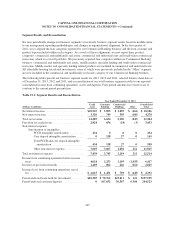
Assets and Liabilities Measured at Fair Value on a Nonrecurring Basis
We are required to measure and recognize certain other financial assets at fair value on a nonrecurring basis in
the consolidated balance sheets. These financial assets are not measured at fair value on an ongoing basis but are
subject to fair value adjustments in certain circumstances (for example, when we evaluate impairment). The
following table presents the carrying amount of the assets measured at fair value on a nonrecurring basis and still
held as of December 31, 2013 and 2012, the significant valuation techniques and unobservable inputs used in
those measurement, and total gain or losses recognized in earnings during the years ended December 31, 2013
and 2012 attributable to the fair value changes relating to these assets:
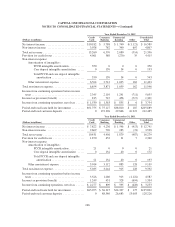
Table 18.4: Nonrecurring Fair Value Measurements Related to Assets Still Held at Period End
December 31, 2013
Estimated
Fair Value Hierarchy
Total
Significant
Valuation
Techniques
Significant
Unobservable
Inputs Range
Weighted
Average
Gains (Losses)
for Year Ended
12/31/13(Dollars in millions) Level 1 Level 2 Level 3
Assets:
Loans held for
sale ......... $0 $145 $ 0 $145 N/A N/A N/A N/A $ (1)
Loans held for
investment . . . 0 0 84 84
Appraisal
Value
Non-recoverable
rate 0-42% 13% (28)
Other assets(1) ... 0 0 64 64
Fair value of
property or
collateral
Appraisal
Value N/A N/A (23)
Total .......... $0 $145 $148 $293 $(52)
December 31, 2012
Estimated
Fair Value Hierarchy
Total
Significant
Valuation
Techniques
Significant
Unobservable
Inputs Range
Weighted
Average
Gains (Losses)
for Year Ended
12/31/12(Dollars in millions) Level 1 Level 2 Level 3
Assets:
Loans held for
sale .......... $0 $201 $ 0 $201 N/A N/A N/A N/A $ 0
Loans held for
investment . . . . . 0 0 162 162
Appraisal
Value
Non-recoverable
rate 0-100% 13% (50)
Other assets(1) . . . . 0 0 109 109
Fair value of
property or
collateral
Appraisal
Value N/A N/A (31)
Total ........... $0 $201 $271 $472 $(81)
(1) Included foreclosed property and repossessed assets of $42 million and long-lived assets held for sale of $22 million as of December 31,
2013. Comparatively, included foreclosed property and repossessed assets of $50 million and long-lived assets held for sale of $59
million as of December 31, 2012. The fair value of these assets is determined based on appraisal value or sales price, the range of which
is not meaningful to disclose.
237