Capital One 2013 Annual Report Download - page 134
Download and view the complete annual report
Please find page 134 of the 2013 Capital One annual report below. You can navigate through the pages in the report by either clicking on the pages listed below, or by using the keyword search tool below to find specific information within the annual report.-
 1
1 -
2
-
3
-
4
-
5
-
6
-
7
-
8
-
9
-
10
-
11
-
12
-
13
-
14
-
15
-
16
-
17
-
18
-
19
-
20
-
21
-
22
-
23
-
24
-
25
-
26
-
27
-
28
-
29
-
30
-
31
-
32
-
33
-
34
-
35
-
36
-
37
-
38
-
39
-
40
-
41
-
42
-
43
-
44
-
45
-
46
-
47
-
48
-
49
-
50
-
51
-
52
-
53
-
54
-
55
-
56
-
57
-
58
-
59
-
60
-
61
-
62
-
63
-
64
-
65
-
66
-
67
-
68
-
69
-
70
-
71
-
72
-
73
-
74
-
75
-
76
-
77
-
78
-
79
-
80
-
81
-
82
-
83
-
84
-
85
-
86
-
87
-
88
-
89
-
90
-
91
-
92
-
93
-
94
-
95
-
96
-
97
-
98
-
99
-
100
-
101
-
102
-
103
-
104
-
105
-
106
-
107
-
108
-
109
-
110
-
111
-
112
-
113
-
114
-
115
-
116
-
117
-
118
-
119
-
120
-
121
-
122
-
123
-
 124
124 -
 125
125 -
 126
126 -
 127
127 -
 128
128 -
 129
129 -
 130
130 -
 131
131 -
 132
132 -
 133
133 -
 134
134 -
 135
135 -
 136
136 -
 137
137 -
 138
138 -
 139
139 -
 140
140 -
 141
141 -
 142
142 -
 143
143 -
 144
144 -
145
-
146
-
147
-
148
-
149
-
150
-
151
-
152
-
153
-
154
-
155
-
156
-
157
-
158
-
159
-
160
-
161
-
162
-
163
-
164
-
165
-
166
-
167
-
168
-
169
-
170
-
171
-
172
-
173
-
174
-
175
-
176
-
177
-
178
-
179
-
180
-
181
-
182
-
183
-
184
-
185
-
186
-
187
-
188
-
189
-
190
-
191
-
192
-
193
-
194
-
195
-
196
-
197
-
198
-
199
-
200
-
201
-
202
-
203
-
204
-
205
-
206
-
207
-
208
-
209
-
210
-
211
-
212
-
213
-
214
-
215
-
216
-
217
-
218
-
219
-
220
-
221
-
222
-
223
-
224
-
225
-
226
-
227
-
228
-
229
-
230
-
231
-
232
-
233
-
234
-
235
-
236
-
237
-
238
-
239
-
240
-
241
-
242
-
243
-
244
-
245
-
246
-
247
-
248
-
249
-
250
-
251
-
252
-
253
-
254
-
255
-
256
-
257
-
258
-
259
-
260
-
261
-
262
-
263
-
264
-
265
-
266
-
267
-
268
-
269
-
270
-
271
-
272
-
273
-
274
-
275
-
276
-
277
-
278
-
279
-
280
-
281
-
282
-
283
-
284
-
285
-
286
-
287
-
288
-
289
-
290
-
291
-
292
-
293
-
294
-
295
-
296
-
297
-
298
-
299
-
300
-
301
-
302
 |
 |

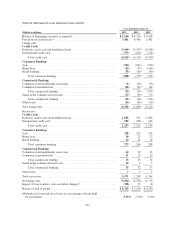
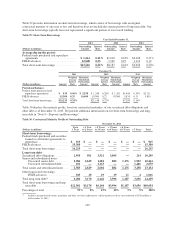
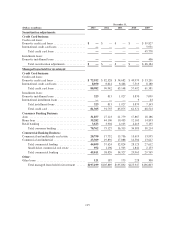
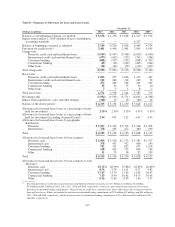
SUPPLEMENTAL TABLES
See “Part II- Item 6. Selected Financial Data” for information on our supplemental non-GAAP managed results,
which we presented prior to our January 1, 2010 prospective adoption of the new consolidation standards. The
adoption of these new accounting standards resulted in the consolidation of substantially all of our securitization
trusts. As a result, our reported and managed based presentations are generally comparable for periods beginning
after January 1, 2010.
Table A—Loan Portfolio Composition
December 31,
(Dollars in millions) 2013 2012 2011 2010 2009
Reported loans held for investment:
Credit Card:
Credit card loans:
Domestic credit card loans ....................... $ 72,932 $ 82,328 $ 54,682 $ 49,979 $13,374
International credit card loans .................... 8,050 8,614 8,466 7,513 2,229
Total credit card loans ...................... 80,982 90,942 63,148 57,492 15,603
Installment loans:
Domestic installment loans ...................... 323 813 1,927 3,870 6,693
International installment loans .................... —— — 9 44
Total installment loans. ..................... 323 813 1,927 3,879 6,737
Total credit card ........................... 81,305 91,755 65,075 61,371 22,340
Consumer Banking:
Auto ........................................ 31,857 27,123 21,779 17,867 18,186
Home loan ................................... 35,282 44,100 10,433 12,103 14,893
Retail banking ................................ 3,623 3,904 4,103 4,413 5,135
Total consumer banking ..................... 70,762 75,127 36,315 34,383 38,214
Commercial Banking:
Commercial and multifamily real estate ............ 20,750 17,732 15,736 13,619 13,995
Commercial and industrial ....................... 23,309 19,892 17,088 14,504 13,617
Total commercial lending ................... 44,059 37,624 32,824 28,123 27,612
Small-ticket commercial real estate ................ 952 1,196 1,503 1,842 2,153
Total commercial banking ................... 45,011 38,820 34,327 29,965 29,765
Other:
Other loans ................................... 121 187 175 228 300
Total reported loans held for investment ........ $197,199 $205,889 $135,892 $125,947 $90,619
114