Capital One 2013 Annual Report Download - page 81
Download and view the complete annual report
Please find page 81 of the 2013 Capital One annual report below. You can navigate through the pages in the report by either clicking on the pages listed below, or by using the keyword search tool below to find specific information within the annual report.-
 1
1 -
2
-
3
-
4
-
5
-
6
-
7
-
8
-
9
-
10
-
11
-
12
-
13
-
14
-
15
-
16
-
17
-
18
-
19
-
20
-
21
-
22
-
23
-
24
-
25
-
26
-
27
-
28
-
29
-
30
-
31
-
32
-
33
-
34
-
35
-
36
-
37
-
38
-
39
-
40
-
41
-
42
-
43
-
44
-
45
-
46
-
47
-
48
-
49
-
50
-
51
-
52
-
53
-
54
-
55
-
56
-
57
-
58
-
59
-
60
-
61
-
62
-
63
-
64
-
65
-
66
-
67
-
68
-
69
-
70
-
 71
71 -
 72
72 -
 73
73 -
 74
74 -
 75
75 -
 76
76 -
 77
77 -
 78
78 -
 79
79 -
 80
80 -
 81
81 -
 82
82 -
 83
83 -
 84
84 -
 85
85 -
 86
86 -
 87
87 -
 88
88 -
 89
89 -
 90
90 -
 91
91 -
92
-
93
-
94
-
95
-
96
-
97
-
98
-
99
-
100
-
101
-
102
-
103
-
104
-
105
-
106
-
107
-
108
-
109
-
110
-
111
-
112
-
113
-
114
-
115
-
116
-
117
-
118
-
119
-
120
-
121
-
122
-
123
-
124
-
125
-
126
-
127
-
128
-
129
-
130
-
131
-
132
-
133
-
134
-
135
-
136
-
137
-
138
-
139
-
140
-
141
-
142
-
143
-
144
-
145
-
146
-
147
-
148
-
149
-
150
-
151
-
152
-
153
-
154
-
155
-
156
-
157
-
158
-
159
-
160
-
161
-
162
-
163
-
164
-
165
-
166
-
167
-
168
-
169
-
170
-
171
-
172
-
173
-
174
-
175
-
176
-
177
-
178
-
179
-
180
-
181
-
182
-
183
-
184
-
185
-
186
-
187
-
188
-
189
-
190
-
191
-
192
-
193
-
194
-
195
-
196
-
197
-
198
-
199
-
200
-
201
-
202
-
203
-
204
-
205
-
206
-
207
-
208
-
209
-
210
-
211
-
212
-
213
-
214
-
215
-
216
-
217
-
218
-
219
-
220
-
221
-
222
-
223
-
224
-
225
-
226
-
227
-
228
-
229
-
230
-
231
-
232
-
233
-
234
-
235
-
236
-
237
-
238
-
239
-
240
-
241
-
242
-
243
-
244
-
245
-
246
-
247
-
248
-
249
-
250
-
251
-
252
-
253
-
254
-
255
-
256
-
257
-
258
-
259
-
260
-
261
-
262
-
263
-
264
-
265
-
266
-
267
-
268
-
269
-
270
-
271
-
272
-
273
-
274
-
275
-
276
-
277
-
278
-
279
-
280
-
281
-
282
-
283
-
284
-
285
-
286
-
287
-
288
-
289
-
290
-
291
-
292
-
293
-
294
-
295
-
296
-
297
-
298
-
299
-
300
-
301
-
302
 |
 |

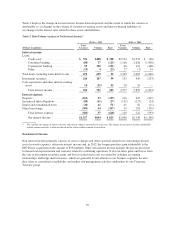
Provision for Credit Losses
Our provision for credit losses in each period is driven by charge-offs, changes to the allowance for loan and
lease losses, and changes to the reserve for unfunded lending commitments. We recorded a provision for credit
losses of $3.5 billion in 2013, compared with $4.4 billion in 2012 and $2.4 billion in 2011. The provision for
credit losses as a percentage of net interest income was 19.1%, 26.6%, and 18.5% in 2013, 2012, and 2011,
respectively.
The decrease in the provision for credit losses of $962 million in 2013 from 2012 was driven by the absence of
the provision for credit losses of $1.2 billion recorded in the second quarter of 2012 to establish an allowance for
credit card loans acquired in the 2012 U.S. card acquisition, and lower provision for credit losses in our non-
acquired portfolio as underlying credit has improved. This was partially offset by (i) an increase in charge offs on
the portfolio of Acquired Loans, as the Acquired Loans have run-off and have been replaced with originated
loans which do not have a credit mark to absorb the charge-offs (ii) lower allowance release in our Commercial
Banking business due to stabilization of the credit outlook in the current year compared to 2012, and (iii) higher
charge offs on our Auto portfolio in our Consumer Banking segment reflecting portfolio growth and increased
charge off rates from historically low levels.
The increase in the provision for credit losses of $2.0 billion in 2012 from 2011 was primarily related to the
addition of the $26.2 billion in outstanding receivables acquired in the 2012 U.S. card acquisition designated as
held for investment that had existing revolving privileges at acquisition. These loans were recorded at a fair value
of $26.9 billion, resulting in a net premium of $705 million at acquisition, and we recorded an allowance of
$1.2 billion for these loans.
We provide additional information on the provision for credit losses and changes in the allowance for loan and
lease losses under the “Credit Risk Profile—Summary of Allowance for Loan and Lease Losses”, “Note 4—
Loans” and “Note 5—Allowance for Loan and Lease Losses.” For information on the allowance methodology for
each of our loan categories, see “Note 1—Summary of Significant Accounting Policies.”
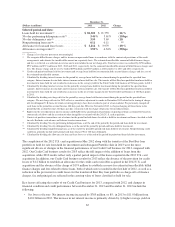
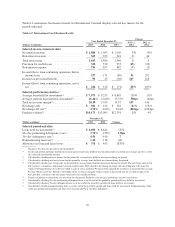
Non-Interest Expense
Non-interest expense consists of ongoing operating costs, such as salaries and associate benefits, occupancy and
equipment costs, professional services, communications and data processing technology expenses and other
miscellaneous expenses. Non-interest expense also includes marketing costs, merger-related expense and
amortization of intangibles. Table 5 displays the components of non-interest expense for 2013, 2012 and 2011.
Table 5: Non-Interest Expense
Year Ended December 31,
(Dollars in millions) 2013 2012 2011
Salaries and associate benefits ......................................... $ 4,432 $ 3,876 $3,023
Occupancy and equipment ............................................ 1,504 1,327 1,025
Marketing ......................................................... 1,373 1,364 1,337
Professional services ................................................ 1,303 1,270 1,198
Communications and data processing ................................... 885 778 681
Amortization of intangibles ........................................... 671 609 222
Acquisition-related .................................................. 193 336 45
Other non-interest expense:
Collections .................................................... 470 544 563
Fraud losses ................................................... 218 190 122
Bankcard, regulatory and other fee assessments ....................... 562 525 394
Other ......................................................... 903 1,127 722
Other non-interest expense ............................................ 2,153 2,386 1,801
Total non-interest expense ............................................ $12,514 $11,946 $9,332
61