Capital One 2013 Annual Report Download - page 105
Download and view the complete annual report
Please find page 105 of the 2013 Capital One annual report below. You can navigate through the pages in the report by either clicking on the pages listed below, or by using the keyword search tool below to find specific information within the annual report.-
 1
1 -
2
-
3
-
4
-
5
-
6
-
7
-
8
-
9
-
10
-
11
-
12
-
13
-
14
-
15
-
16
-
17
-
18
-
19
-
20
-
21
-
22
-
23
-
24
-
25
-
26
-
27
-
28
-
29
-
30
-
31
-
32
-
33
-
34
-
35
-
36
-
37
-
38
-
39
-
40
-
41
-
42
-
43
-
44
-
45
-
46
-
47
-
48
-
49
-
50
-
51
-
52
-
53
-
54
-
55
-
56
-
57
-
58
-
59
-
60
-
61
-
62
-
63
-
64
-
65
-
66
-
67
-
68
-
69
-
70
-
71
-
72
-
73
-
74
-
75
-
76
-
77
-
78
-
79
-
80
-
81
-
82
-
83
-
84
-
85
-
86
-
87
-
88
-
89
-
90
-
91
-
92
-
93
-
94
-
 95
95 -
 96
96 -
 97
97 -
 98
98 -
 99
99 -
 100
100 -
 101
101 -
 102
102 -
 103
103 -
 104
104 -
 105
105 -
 106
106 -
 107
107 -
 108
108 -
 109
109 -
 110
110 -
 111
111 -
 112
112 -
 113
113 -
 114
114 -
 115
115 -
116
-
117
-
118
-
119
-
120
-
121
-
122
-
123
-
124
-
125
-
126
-
127
-
128
-
129
-
130
-
131
-
132
-
133
-
134
-
135
-
136
-
137
-
138
-
139
-
140
-
141
-
142
-
143
-
144
-
145
-
146
-
147
-
148
-
149
-
150
-
151
-
152
-
153
-
154
-
155
-
156
-
157
-
158
-
159
-
160
-
161
-
162
-
163
-
164
-
165
-
166
-
167
-
168
-
169
-
170
-
171
-
172
-
173
-
174
-
175
-
176
-
177
-
178
-
179
-
180
-
181
-
182
-
183
-
184
-
185
-
186
-
187
-
188
-
189
-
190
-
191
-
192
-
193
-
194
-
195
-
196
-
197
-
198
-
199
-
200
-
201
-
202
-
203
-
204
-
205
-
206
-
207
-
208
-
209
-
210
-
211
-
212
-
213
-
214
-
215
-
216
-
217
-
218
-
219
-
220
-
221
-
222
-
223
-
224
-
225
-
226
-
227
-
228
-
229
-
230
-
231
-
232
-
233
-
234
-
235
-
236
-
237
-
238
-
239
-
240
-
241
-
242
-
243
-
244
-
245
-
246
-
247
-
248
-
249
-
250
-
251
-
252
-
253
-
254
-
255
-
256
-
257
-
258
-
259
-
260
-
261
-
262
-
263
-
264
-
265
-
266
-
267
-
268
-
269
-
270
-
271
-
272
-
273
-
274
-
275
-
276
-
277
-
278
-
279
-
280
-
281
-
282
-
283
-
284
-
285
-
286
-
287
-
288
-
289
-
290
-
291
-
292
-
293
-
294
-
295
-
296
-
297
-
298
-
299
-
300
-
301
-
302
 |
 |

developed by the Basel Committee and certain Dodd-Frank Act capital provisions and updates the PCA capital
requirements. The new capital framework establishes a new minimum Common Equity Tier 1 capital ratio that
will be phased-in starting in 2014 for bank holding companies subject to the “Advanced” risk-based capital rules
adopted by the U.S. federal banking agencies (“Advanced Approaches”). The Final Rule also increases some of
the thresholds for the PCA capital categories and adds, effective January 1, 2015, the new Common Equity Tier 1
capital ratio to the PCA regulations.
We disclose a non-GAAP TCE ratio in “Summary of Selected Financial Data.” While the TCE ratio is a capital
measure widely used by investors, analysts and bank regulatory agencies to assess the capital position of
financial services companies, it may not be comparable to similarly titled measures reported by other companies.
We provide information on the calculation of this ratio in “MD&A—Supplemental Tables—Table F:
Reconciliation of Non-GAAP Measures and Calculation of Regulatory Capital Measures Under Basel I.”
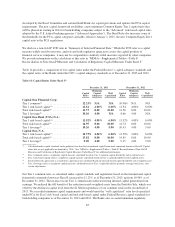
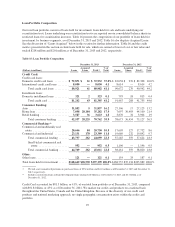
Table 14 provides a comparison of our capital ratios under the Federal Reserve’s capital adequacy standards and
the capital ratios of the Banks under the OCC’s capital adequacy standards as of December 31, 2013 and 2012.
Table 14: Capital Ratios Under Basel I(1)
December 31, 2013 December 31, 2012
Capital
Ratio
Minimum
Capital
Adequacy
Well
Capitalized
Capital
Ratio
Minimum
Capital
Adequacy
Well
Capitalized
Capital One Financial Corp:
Tier 1 common(2) ......................... 12.23% N/A N/A 10.96% N/A N/A
Tier 1 risk-based capital(3) .................. 12.61 4.00% 6.00% 11.34 4.00% 6.00%
Total risk-based capital(4) ................... 14.73 8.00 10.00 13.56 8.00 10.00
Tier 1 leverage(5) .......................... 10.10 4.00 N/A 8.66 4.00 N/A
Capital One Bank (USA) N.A.:
Tier 1 risk-based capital(3) .................. 11.52% 4.00% 6.00% 11.32% 4.00% 6.00%
Total risk-based capital(4) ................... 14.95 8.00 10.00 14.74 8.00 10.00
Tier 1 leverage(5) .......................... 10.26 4.00 5.00 10.43 4.00 5.00
Capital One, N.A:
Tier 1 risk-based capital(3) .................. 12.73% 4.00% 6.00% 13.59% 4.00% 6.00%
Total risk-based capital(4) ................... 13.82 8.00 10.00 14.85 8.00 10.00
Tier 1 leverage(5) .......................... 9.00 4.00 5.00 9.15 4.00 5.00
(1) Calculated under capital standards and regulations based on the international capital framework commonly known as Basel I. Capital
ratios that are not applicable are denoted by “N/A.” See “MD&A—Supplemental Tables—Table F: Reconciliation of Non-GAAP
Measures and Calculation of Regulatory Capital Measures Under Basel I” for additional information.
(2) Tier 1 common ratio is a regulatory capital measure calculated based on Tier 1 common capital divided by risk-weighted assets.
(3) Tier 1 risk-based capital ratio is a regulatory capital measure calculated based on Tier 1 capital divided by risk-weighted assets.
(4) Total risk-based capital ratio is a regulatory capital measure calculated based on total risk-based capital divided by risk-weighted assets.
(5) Tier 1 leverage ratio is a regulatory capital measure calculated based on Tier 1 capital divided by quarterly average total assets, after
certain adjustments.
Our Tier 1 common ratio, as calculated under capital standards and regulations based on the international capital
framework commonly known as Basel I, increased to 12.23% as of December 31, 2013, up from 10.96% as of
December 31, 2012. The increase in our Tier 1 common ratio reflected strong internal capital generation from
earnings. We realized the full benefit of the reduction in risk weighted assets from the Portfolio Sale, which was
offset by the decline in capital level from the $1 billion repurchase of our common stock in the second half of
2013. We exceeded minimum capital requirements and would meet the “well capitalized” ratio levels specified
under PCA for Tier 1 risk-based capital and total risk-based capital under Federal Reserve capital standards for
bank holding companies as of December 31, 2013 and 2012. The Banks also exceeded minimum regulatory
85