Capital One 2013 Annual Report Download - page 283
Download and view the complete annual report
Please find page 283 of the 2013 Capital One annual report below. You can navigate through the pages in the report by either clicking on the pages listed below, or by using the keyword search tool below to find specific information within the annual report.-
 1
1 -
2
-
3
-
4
-
5
-
6
-
7
-
8
-
9
-
10
-
11
-
12
-
13
-
14
-
15
-
16
-
17
-
18
-
19
-
20
-
21
-
22
-
23
-
24
-
25
-
26
-
27
-
28
-
29
-
30
-
31
-
32
-
33
-
34
-
35
-
36
-
37
-
38
-
39
-
40
-
41
-
42
-
43
-
44
-
45
-
46
-
47
-
48
-
49
-
50
-
51
-
52
-
53
-
54
-
55
-
56
-
57
-
58
-
59
-
60
-
61
-
62
-
63
-
64
-
65
-
66
-
67
-
68
-
69
-
70
-
71
-
72
-
73
-
74
-
75
-
76
-
77
-
78
-
79
-
80
-
81
-
82
-
83
-
84
-
85
-
86
-
87
-
88
-
89
-
90
-
91
-
92
-
93
-
94
-
95
-
96
-
97
-
98
-
99
-
100
-
101
-
102
-
103
-
104
-
105
-
106
-
107
-
108
-
109
-
110
-
111
-
112
-
113
-
114
-
115
-
116
-
117
-
118
-
119
-
120
-
121
-
122
-
123
-
124
-
125
-
126
-
127
-
128
-
129
-
130
-
131
-
132
-
133
-
134
-
135
-
136
-
137
-
138
-
139
-
140
-
141
-
142
-
143
-
144
-
145
-
146
-
147
-
148
-
149
-
150
-
151
-
152
-
153
-
154
-
155
-
156
-
157
-
158
-
159
-
160
-
161
-
162
-
163
-
164
-
165
-
166
-
167
-
168
-
169
-
170
-
171
-
172
-
173
-
174
-
175
-
176
-
177
-
178
-
179
-
180
-
181
-
182
-
183
-
184
-
185
-
186
-
187
-
188
-
189
-
190
-
191
-
192
-
193
-
194
-
195
-
196
-
197
-
198
-
199
-
200
-
201
-
202
-
203
-
204
-
205
-
206
-
207
-
208
-
209
-
210
-
211
-
212
-
213
-
214
-
215
-
216
-
217
-
218
-
219
-
220
-
221
-
222
-
223
-
224
-
225
-
226
-
227
-
228
-
229
-
230
-
231
-
232
-
233
-
234
-
235
-
236
-
237
-
238
-
239
-
240
-
241
-
242
-
243
-
244
-
245
-
246
-
247
-
248
-
249
-
250
-
251
-
252
-
253
-
254
-
255
-
256
-
257
-
258
-
259
-
260
-
261
-
262
-
263
-
264
-
265
-
266
-
267
-
268
-
269
-
270
-
271
-
272
-
 273
273 -
 274
274 -
 275
275 -
 276
276 -
 277
277 -
 278
278 -
 279
279 -
 280
280 -
 281
281 -
 282
282 -
 283
283 -
 284
284 -
 285
285 -
 286
286 -
 287
287 -
 288
288 -
 289
289 -
 290
290 -
 291
291 -
 292
292 -
 293
293 -
294
-
295
-
296
-
297
-
298
-
299
-
300
-
301
-
302
 |
 |

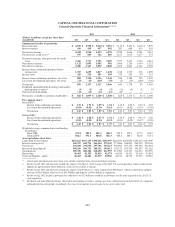
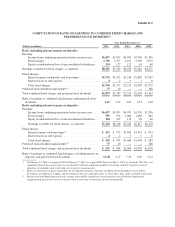
CAPITAL ONE FINANCIAL CORPORATION
Selected Quarterly Financial Information(1) (2) (3)
2013 2012
(Dollars in millions, except per share data)
(unaudited) Q4 Q3 Q2 Q1 Q4 Q3 Q2 Q1
Summarized results of operations:
Interest income ...........................$ 4,839 $ 4,998 $ 5,010 $ 5,051 $ 5,115 $ 5,254 $ 4,616 $ 3,979
Interest expense ........................... 416 438 457 481 587 608 615 565
Net interest income ........................ 4,423 4,560 4,553 4,570 4,528 4,646 4,001 3,414
Provision for credit losses(4) ................. 957 849 762 885 1,151 1,014 1,677 573
Net interest income after provision for credit
losses ................................. 3,466 3,711 3,791 3,685 3,377 3,632 2,324 2,841
Non-interest income ....................... 1,121 1,091 1,085 981 1,096 1,136 1,054 1,521
Non-interest expense ....................... 3,280 3,147 3,059 3,028 3,255 3,045 3,142 2,504
Income from continuing operations before
income taxes ........................... 1,307 1,655 1,817 1,638 1,218 1,723 236 1,858
Income taxes ............................. 425 525 581 494 370 535 43 353
Income from continuing operations, net of tax . . . 882 1,130 1,236 1,144 848 1,188 193 1,505
Loss from discontinued operations, net of tax . . . (23) (13) (119) (78) (5) (10) (100) (102)
Net income .............................. 859 1,117 1,117 1,066 843 1,178 93 1,403
Dividends and undistributed earnings allocated to
participating securities(5) .................. (4) (5) (4) (5) (3) (5) (1) (7)
Preferred stock dividends ................... (13) (13) (13) (13) (15) — — —
Net income available to common stockholders . . . $ 842 $ 1,099 $ 1,100 $ 1,048 $ 825 $ 1,173 $ 92 $ 1,396
Per common share:
Basic EPS(5) :
Income from continuing operations .......$ 1.51 $ 1.91 $ 2.09 $ 1.94 $ 1.43 $ 2.05 $ 0.33 $ 2.94
Loss from discontinued operations ........ (0.04) (0.02) (0.20) (0.13) (0.01) (0.02) (0.17) (0.20)
Net income ..........................$ 1.47 $ 1.89 $ 1.89 $ 1.81 $ 1.42 $ 2.03 $ 0.16 $ 2.74
Diluted EPS(5) :
Income from continuing operations .......$ 1.48 $ 1.88 $ 2.07 $ 1.92 $ 1.42 $ 2.03 $ 0.33 $ 2.92
Loss from discontinued operations ........ (0.03) (0.02) (0.20) (0.13) (0.01) (0.02) (0.17) (0.20)
Net income ..........................$ 1.45 $ 1.86 $ 1.87 $ 1.79 $ 1.41 $ 2.01 $ 0.16 $ 2.72
Weighted average common shares outstanding
(In millions):
Basic EPS ........................... 573.4 582.3 581.5 580.5 579.2 578.3 577.7 508.7
Diluted EPS .......................... 582.6 591.1 588.8 586.3 585.6 584.1 582.8 513.1
Average balance sheet data:
Loans held for investment ...................$192,813 $191,135 $190,562 $195,997 $202,944 $202,856 $192,632 $152,900
Interest-earning assets ...................... 262,957 264,796 266,544 272,345 277,886 266,803 265,019 220,246
Total assets .............................. 294,108 294,939 297,766 303,223 308,096 297,154 295,306 246,384
Interest-bearing deposits .................... 184,206 186,752 189,311 190,612 192,122 193,700 195,597 151,625
Total deposits ............................ 205,706 208,340 210,650 211,555 213,494 213,323 214,914 170,259
Borrowings .............................. 36,463 36,355 36,915 41,574 44,189 36,451 35,418 35,994
Total stockholders’ equity ................... 42,463 41,284 41,579 40,960 40,212 38,535 37,533 32,982
(1) Certain prior period amounts have been reclassified to conform to the current period presentation.
(2) Results for Q2 2012 and thereafter include the impact of the May 1, 2012 closing of the 2012 U.S. card acquisition, which resulted in the
addition of approximately $28.2 billion in credit card receivables at closing.
(3) Results for Q1 2012 and thereafter include the impact of the February 17, 2012 acquisition of ING Direct, which resulted in the addition
of loans of $40.4 billion, other assets of $53.9 billion and deposits of $84.4 billion at acquisition.
(4) Results for Q2 2012 include a provision for credit losses of $1.2 billion to establish an allowance for the loans acquired in the 2012 U.S.
card acquisition.
(5) Dividends and undistributed earnings allocated to participating securities, earnings per share, and preferred stock dividends are computed
independently for each period. Accordingly, the sum of each quarter may not agree to the year-to-date total.
263