Capital One 2013 Annual Report Download - page 191
Download and view the complete annual report
Please find page 191 of the 2013 Capital One annual report below. You can navigate through the pages in the report by either clicking on the pages listed below, or by using the keyword search tool below to find specific information within the annual report.-
 1
1 -
2
-
3
-
4
-
5
-
6
-
7
-
8
-
9
-
10
-
11
-
12
-
13
-
14
-
15
-
16
-
17
-
18
-
19
-
20
-
21
-
22
-
23
-
24
-
25
-
26
-
27
-
28
-
29
-
30
-
31
-
32
-
33
-
34
-
35
-
36
-
37
-
38
-
39
-
40
-
41
-
42
-
43
-
44
-
45
-
46
-
47
-
48
-
49
-
50
-
51
-
52
-
53
-
54
-
55
-
56
-
57
-
58
-
59
-
60
-
61
-
62
-
63
-
64
-
65
-
66
-
67
-
68
-
69
-
70
-
71
-
72
-
73
-
74
-
75
-
76
-
77
-
78
-
79
-
80
-
81
-
82
-
83
-
84
-
85
-
86
-
87
-
88
-
89
-
90
-
91
-
92
-
93
-
94
-
95
-
96
-
97
-
98
-
99
-
100
-
101
-
102
-
103
-
104
-
105
-
106
-
107
-
108
-
109
-
110
-
111
-
112
-
113
-
114
-
115
-
116
-
117
-
118
-
119
-
120
-
121
-
122
-
123
-
124
-
125
-
126
-
127
-
128
-
129
-
130
-
131
-
132
-
133
-
134
-
135
-
136
-
137
-
138
-
139
-
140
-
141
-
142
-
143
-
144
-
145
-
146
-
147
-
148
-
149
-
150
-
151
-
152
-
153
-
154
-
155
-
156
-
157
-
158
-
159
-
160
-
161
-
162
-
163
-
164
-
165
-
166
-
167
-
168
-
169
-
170
-
171
-
172
-
173
-
174
-
175
-
176
-
177
-
178
-
179
-
180
-
 181
181 -
 182
182 -
 183
183 -
 184
184 -
 185
185 -
 186
186 -
 187
187 -
 188
188 -
 189
189 -
 190
190 -
 191
191 -
 192
192 -
 193
193 -
 194
194 -
 195
195 -
 196
196 -
 197
197 -
 198
198 -
 199
199 -
 200
200 -
 201
201 -
202
-
203
-
204
-
205
-
206
-
207
-
208
-
209
-
210
-
211
-
212
-
213
-
214
-
215
-
216
-
217
-
218
-
219
-
220
-
221
-
222
-
223
-
224
-
225
-
226
-
227
-
228
-
229
-
230
-
231
-
232
-
233
-
234
-
235
-
236
-
237
-
238
-
239
-
240
-
241
-
242
-
243
-
244
-
245
-
246
-
247
-
248
-
249
-
250
-
251
-
252
-
253
-
254
-
255
-
256
-
257
-
258
-
259
-
260
-
261
-
262
-
263
-
264
-
265
-
266
-
267
-
268
-
269
-
270
-
271
-
272
-
273
-
274
-
275
-
276
-
277
-
278
-
279
-
280
-
281
-
282
-
283
-
284
-
285
-
286
-
287
-
288
-
289
-
290
-
291
-
292
-
293
-
294
-
295
-
296
-
297
-
298
-
299
-
300
-
301
-
302
 |
 |

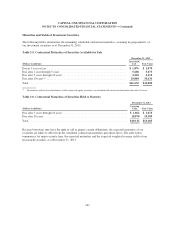
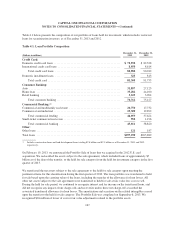
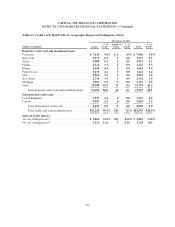
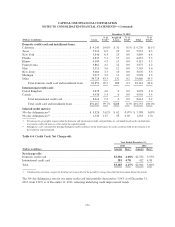
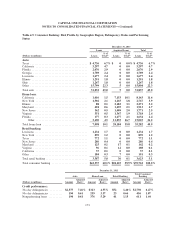
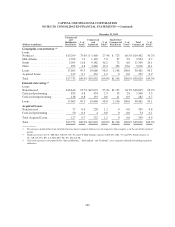
CAPITAL ONE FINANCIAL CORPORATION
NOTES TO CONSOLIDATED FINANCIAL STATEMENTS—(Continued)
December 31, 2012
(Dollars in millions) Loans
% of
Total(1)
Acquired
Loans
% of
Total(1) Total
% of
Total(1)
Domestic credit card and installment loans:
California ..................................... $ 9,245 10.0% $ 31 0.1% $ 9,276 10.1%
Texas ........................................ 5,910 6.5 23 0.0 5,933 6.5
New York .................................... 5,846 6.4 23 0.0 5,869 6.4
Florida ....................................... 4,835 5.3 17 0.0 4,852 5.3
Illinois ....................................... 4,100 4.5 15 0.0 4,115 4.5
Pennsylvania .................................. 3,861 4.2 14 0.0 3,875 4.2
Ohio ......................................... 3,351 3.6 12 0.0 3,363 3.6
New Jersey ................................... 3,060 3.3 10 0.0 3,070 3.3
Michigan ..................................... 2,917 3.2 11 0.0 2,928 3.2
Other ........................................ 39,728 43.3 132 0.2 39,860 43.5
Total domestic credit card and installment loans . . 82,853 90.3 288 0.3 83,141 90.6
International credit card:
United Kingdom ............................... 3,678 4.0 0 0.0 3,678 4.0
Canada ....................................... 4,936 5.4 0 0.0 4,936 5.4
Total international credit card ................. 8,614 9.4 0 0.0 8,614 9.4
Total credit card and installment loans .......... $91,467 99.7% $288 0.3% $91,755 100.0%
Selected credit metrics:
30+ day delinquencies(2) ......................... $ 3,326 3.62% $ 62 0.07% $ 3,388 3.69%
90+ day delinquencies(2) ......................... 1,530 1.67 33 0.03 1,563 1.70
(1) Percentages by geographic region within the domestic and international credit card portfolios are calculated based on the total held-for-
investment credit card loans as of the end of the reported period.
(2) Delinquency rates calculated by dividing delinquent credit card loans by the total balance of credit card loans held for investment as of
the end of the reported period.
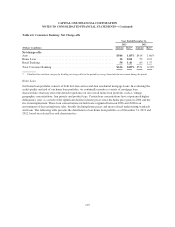
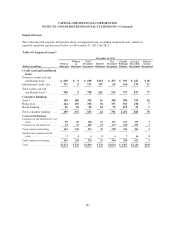
Table 4.4: Credit Card: Net Charge-offs
Year Ended December 31,
2013 2012
(Dollars in millions) Amount Rate(1) Amount Rate(1)
Net charge-offs:
Domestic credit card ............................................. $2,904 4.08% $2,532 3.53%
International credit card .......................................... 381 4.78 412 4.98
Total ......................................................... $3,285 4.15% $2,944 3.68%
(1) Calculated for each loan category by dividing net charge-offs for the period by average loans held for investment during the period.
The 30+ day delinquency rate for our entire credit card loan portfolio decreased to 3.54% as of December 31,
2013, from 3.69% as of December 31, 2012, reflecting underlying credit improvement trends.
171