Capital One 2013 Annual Report Download - page 66
Download and view the complete annual report
Please find page 66 of the 2013 Capital One annual report below. You can navigate through the pages in the report by either clicking on the pages listed below, or by using the keyword search tool below to find specific information within the annual report.-
 1
1 -
2
-
3
-
4
-
5
-
6
-
7
-
8
-
9
-
10
-
11
-
12
-
13
-
14
-
15
-
16
-
17
-
18
-
19
-
20
-
21
-
22
-
23
-
24
-
25
-
26
-
27
-
28
-
29
-
30
-
31
-
32
-
33
-
34
-
35
-
36
-
37
-
38
-
39
-
40
-
41
-
42
-
43
-
44
-
45
-
46
-
47
-
48
-
49
-
50
-
51
-
52
-
53
-
54
-
55
-
 56
56 -
 57
57 -
 58
58 -
 59
59 -
 60
60 -
 61
61 -
 62
62 -
 63
63 -
 64
64 -
 65
65 -
 66
66 -
 67
67 -
 68
68 -
 69
69 -
 70
70 -
 71
71 -
 72
72 -
 73
73 -
 74
74 -
 75
75 -
 76
76 -
77
-
78
-
79
-
80
-
81
-
82
-
83
-
84
-
85
-
86
-
87
-
88
-
89
-
90
-
91
-
92
-
93
-
94
-
95
-
96
-
97
-
98
-
99
-
100
-
101
-
102
-
103
-
104
-
105
-
106
-
107
-
108
-
109
-
110
-
111
-
112
-
113
-
114
-
115
-
116
-
117
-
118
-
119
-
120
-
121
-
122
-
123
-
124
-
125
-
126
-
127
-
128
-
129
-
130
-
131
-
132
-
133
-
134
-
135
-
136
-
137
-
138
-
139
-
140
-
141
-
142
-
143
-
144
-
145
-
146
-
147
-
148
-
149
-
150
-
151
-
152
-
153
-
154
-
155
-
156
-
157
-
158
-
159
-
160
-
161
-
162
-
163
-
164
-
165
-
166
-
167
-
168
-
169
-
170
-
171
-
172
-
173
-
174
-
175
-
176
-
177
-
178
-
179
-
180
-
181
-
182
-
183
-
184
-
185
-
186
-
187
-
188
-
189
-
190
-
191
-
192
-
193
-
194
-
195
-
196
-
197
-
198
-
199
-
200
-
201
-
202
-
203
-
204
-
205
-
206
-
207
-
208
-
209
-
210
-
211
-
212
-
213
-
214
-
215
-
216
-
217
-
218
-
219
-
220
-
221
-
222
-
223
-
224
-
225
-
226
-
227
-
228
-
229
-
230
-
231
-
232
-
233
-
234
-
235
-
236
-
237
-
238
-
239
-
240
-
241
-
242
-
243
-
244
-
245
-
246
-
247
-
248
-
249
-
250
-
251
-
252
-
253
-
254
-
255
-
256
-
257
-
258
-
259
-
260
-
261
-
262
-
263
-
264
-
265
-
266
-
267
-
268
-
269
-
270
-
271
-
272
-
273
-
274
-
275
-
276
-
277
-
278
-
279
-
280
-
281
-
282
-
283
-
284
-
285
-
286
-
287
-
288
-
289
-
290
-
291
-
292
-
293
-
294
-
295
-
296
-
297
-
298
-
299
-
300
-
301
-
302
 |
 |
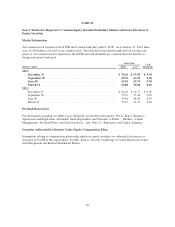
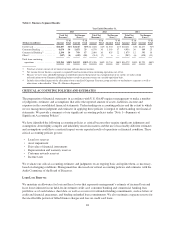
income from continuing operations of $1.1 billion was driven by the absence in 2013 of the provision for
credit losses of $1.2 billion to establish an allowance for the credit card receivables acquired in the 2012
U.S. card acquisition and the absence in 2013 of the $174 million charge to establish a reserve for estimated
uncollectible billed finance charges and fees related to those loans, both of which were recorded in 2012.
The improvement also reflects higher revenue attributable to the 2012 U.S. card acquisition coupled with
increased purchase volume in our Credit Card business. The increase in net revenues was partially offset by
higher operating expenses resulting from the 2012 U.S. card acquisition. Period-end loans held for
investment in our Credit Card business decreased by $10.5 billion to $81.3 billion as of December 31, 2013
from $91.8 billion as of December 31, 2012. The decrease was largely due to the Portfolio Sale and
continued run-off of our installment loan portfolio and certain other credit card loans acquired in the 2012
U.S. card acquisition.
•Consumer Banking: Our Consumer Banking business generated net income from continuing operations of
$1.5 billion in 2013, compared with net income from continuing operations of $1.4 billion in 2012. The
modest increase in net income is due to higher interest income related to growth in average interest earning
assets in auto partially offset by the run-off of home loans. Period-end loans held for investment in our
Consumer Banking business decreased by $4.3 billion, or 6%, to $70.8 billion as of December 31, 2013,
from $75.1 billion as of December 31, 2012, due to the run-off of acquired home loans partially offset by
strong auto loan originations.
•Commercial Banking: Our Commercial Banking business generated net income from continuing operations
of $769 million in 2013, compared with net income from continuing operations of $835 million in 2012.
The decrease in net income of $66 million is due to a higher provision for credit losses. The higher
provision for credit losses was driven by lower allowance releases, which was partially offset by loan
growth in 2013 compared to the prior year. This was partially offset by higher revenues due to growth in
commercial real estate and commercial and industrial loans and higher deposit balances and fee-based
product and services revenue. Period-end loans held for investment in our Commercial Banking business
increased by $6.2 billion, or 16%, to $45.0 billion as of December 31, 2013, from $38.8 billion as of
December 31, 2012. The increase was driven by strong loan originations in the commercial and industrial
and commercial real estate businesses, which were partially offset by the continued run-off of the small-
ticket commercial real estate loan portfolio.
Business Outlook
We discuss below our current expectations regarding our total company performance and the performance of
each of our business segments over the near-term based on market conditions, the regulatory environment and
our business strategies as of the time we filed this Annual Report on Form 10-K. The statements contained in this
section are based on our current expectations regarding our outlook for our financial results and business
strategies. Our expectations take into account, and should be read in conjunction with, our expectations regarding
economic trends and analysis of our business as discussed in “Part I—Item 1. Business” and “Part II—Item 7.
MD&A” of this Report. Certain statements are forward-looking statements within the meaning of the Private
Securities Litigation Reform Act of 1995. Actual results could differ materially from those in our forward-
looking statements. Except as otherwise disclosed, forward-looking statements do not reflect: (i) any change in
current dividend or repurchase strategies, (ii) the effect of any acquisitions, divestitures or similar transactions
that have not been previously disclosed, or (iii) any changes in laws, regulations or regulatory interpretations, in
each case after the date as of which such statements are made. See “Part I—Item 1. Business—Forward-Looking
Statements” for more information on the forward-looking statements in this Report and “Part I—Item 1A. Risk
Factors” in this Report for factors that could materially influence our results.
Total Company Expectations
Our strategies and actions are designed to deliver and sustain strong returns and capital generation through the
acquisition and retention of franchise-enhancing customer relationships across our businesses. We believe that
46