Capital One 2013 Annual Report Download - page 182
Download and view the complete annual report
Please find page 182 of the 2013 Capital One annual report below. You can navigate through the pages in the report by either clicking on the pages listed below, or by using the keyword search tool below to find specific information within the annual report.-
 1
1 -
2
-
3
-
4
-
5
-
6
-
7
-
8
-
9
-
10
-
11
-
12
-
13
-
14
-
15
-
16
-
17
-
18
-
19
-
20
-
21
-
22
-
23
-
24
-
25
-
26
-
27
-
28
-
29
-
30
-
31
-
32
-
33
-
34
-
35
-
36
-
37
-
38
-
39
-
40
-
41
-
42
-
43
-
44
-
45
-
46
-
47
-
48
-
49
-
50
-
51
-
52
-
53
-
54
-
55
-
56
-
57
-
58
-
59
-
60
-
61
-
62
-
63
-
64
-
65
-
66
-
67
-
68
-
69
-
70
-
71
-
72
-
73
-
74
-
75
-
76
-
77
-
78
-
79
-
80
-
81
-
82
-
83
-
84
-
85
-
86
-
87
-
88
-
89
-
90
-
91
-
92
-
93
-
94
-
95
-
96
-
97
-
98
-
99
-
100
-
101
-
102
-
103
-
104
-
105
-
106
-
107
-
108
-
109
-
110
-
111
-
112
-
113
-
114
-
115
-
116
-
117
-
118
-
119
-
120
-
121
-
122
-
123
-
124
-
125
-
126
-
127
-
128
-
129
-
130
-
131
-
132
-
133
-
134
-
135
-
136
-
137
-
138
-
139
-
140
-
141
-
142
-
143
-
144
-
145
-
146
-
147
-
148
-
149
-
150
-
151
-
152
-
153
-
154
-
155
-
156
-
157
-
158
-
159
-
160
-
161
-
162
-
163
-
164
-
165
-
166
-
167
-
168
-
169
-
170
-
171
-
 172
172 -
 173
173 -
 174
174 -
 175
175 -
 176
176 -
 177
177 -
 178
178 -
 179
179 -
 180
180 -
 181
181 -
 182
182 -
 183
183 -
 184
184 -
 185
185 -
 186
186 -
 187
187 -
 188
188 -
 189
189 -
 190
190 -
 191
191 -
 192
192 -
193
-
194
-
195
-
196
-
197
-
198
-
199
-
200
-
201
-
202
-
203
-
204
-
205
-
206
-
207
-
208
-
209
-
210
-
211
-
212
-
213
-
214
-
215
-
216
-
217
-
218
-
219
-
220
-
221
-
222
-
223
-
224
-
225
-
226
-
227
-
228
-
229
-
230
-
231
-
232
-
233
-
234
-
235
-
236
-
237
-
238
-
239
-
240
-
241
-
242
-
243
-
244
-
245
-
246
-
247
-
248
-
249
-
250
-
251
-
252
-
253
-
254
-
255
-
256
-
257
-
258
-
259
-
260
-
261
-
262
-
263
-
264
-
265
-
266
-
267
-
268
-
269
-
270
-
271
-
272
-
273
-
274
-
275
-
276
-
277
-
278
-
279
-
280
-
281
-
282
-
283
-
284
-
285
-
286
-
287
-
288
-
289
-
290
-
291
-
292
-
293
-
294
-
295
-
296
-
297
-
298
-
299
-
300
-
301
-
302
 |
 |

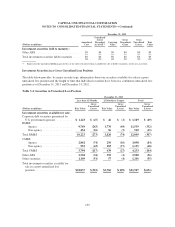
CAPITAL ONE FINANCIAL CORPORATION
NOTES TO CONSOLIDATED FINANCIAL STATEMENTS—(Continued)
Table 3.7: Expected Maturities and Weighted Average Yields of Securities
December 31, 2013
Due in 1 Year
or Less
Due > 1 Year
through
5 Years
Due > 5 Years
through
10 Years Due > 10 Years Total
(Dollars in millions) Amount Amount Amount Amount Amount
Fair value of securities available for sale:
U.S. Treasury debt obligations ........... $ 663 $ 170 $ 0 $ 0 $ 833
U.S. Agency debt obligations ............ 1 0 0 01
Corporate debt securities guaranteed by U.S.
government agencies ................. 0 220 1,001 13 1,234
RMBS:
Agency ......................... 94 5,721 15,664 0 21,479
Non-agency ...................... 42 1,605 1,547 406 3,600
Total RMBS ......................... 136 7,326 17,211 406 25,079
CMBS:
Agency ......................... 358 2,884 956 0 4,198
Non-agency ...................... 110 481 1,199 18 1,808
Total CMBS ......................... 468 3,365 2,155 18 6,006
Other ABS ........................... 1,580 4,628 808 120 7,136
Other securities(1) ..................... 174 503 718 116 1,511
Total securities available for sale ......... 3,022 16,212 21,893 673 41,800
Amortized cost of securities available for
sale .............................. $3,019 $16,028 $22,001 $ 584 $41,632
Weighted average yield for securities
available for sale(2) .................. 1.25% 2.29% 2.68% 7.57% 2.50%
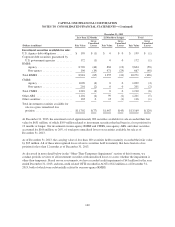
Carrying value of securities held to
maturity:
RMBS:
Agency ......................... $ 0 $ 0 $11,845 $5,598 $17,443
CMBS:
Agency ......................... 0 400 1,281 8 1,689
Total securities held for maturity ......... 0 400 13,126 5,606 19,132
Fair value of securities held to
maturity .......................... $ 0 $ 400 $13,164 $5,621 $19,185
Weighted average yield for securities held
to maturity(2) ...................... 0.00% 3.46% 3.09% 3.33% 3.17%
(1) Yields of tax-exempt securities are calculated on a fully taxable-equivalent (“FTE”) basis.
(2) Yields are calculated based on the amortized cost of each security.
162