Capital One 2013 Annual Report Download - page 132
Download and view the complete annual report
Please find page 132 of the 2013 Capital One annual report below. You can navigate through the pages in the report by either clicking on the pages listed below, or by using the keyword search tool below to find specific information within the annual report.-
 1
1 -
2
-
3
-
4
-
5
-
6
-
7
-
8
-
9
-
10
-
11
-
12
-
13
-
14
-
15
-
16
-
17
-
18
-
19
-
20
-
21
-
22
-
23
-
24
-
25
-
26
-
27
-
28
-
29
-
30
-
31
-
32
-
33
-
34
-
35
-
36
-
37
-
38
-
39
-
40
-
41
-
42
-
43
-
44
-
45
-
46
-
47
-
48
-
49
-
50
-
51
-
52
-
53
-
54
-
55
-
56
-
57
-
58
-
59
-
60
-
61
-
62
-
63
-
64
-
65
-
66
-
67
-
68
-
69
-
70
-
71
-
72
-
73
-
74
-
75
-
76
-
77
-
78
-
79
-
80
-
81
-
82
-
83
-
84
-
85
-
86
-
87
-
88
-
89
-
90
-
91
-
92
-
93
-
94
-
95
-
96
-
97
-
98
-
99
-
100
-
101
-
102
-
103
-
104
-
105
-
106
-
107
-
108
-
109
-
110
-
111
-
112
-
113
-
114
-
115
-
116
-
117
-
118
-
119
-
120
-
121
-
 122
122 -
 123
123 -
 124
124 -
 125
125 -
 126
126 -
 127
127 -
 128
128 -
 129
129 -
 130
130 -
 131
131 -
 132
132 -
 133
133 -
 134
134 -
 135
135 -
 136
136 -
 137
137 -
 138
138 -
 139
139 -
 140
140 -
 141
141 -
 142
142 -
143
-
144
-
145
-
146
-
147
-
148
-
149
-
150
-
151
-
152
-
153
-
154
-
155
-
156
-
157
-
158
-
159
-
160
-
161
-
162
-
163
-
164
-
165
-
166
-
167
-
168
-
169
-
170
-
171
-
172
-
173
-
174
-
175
-
176
-
177
-
178
-
179
-
180
-
181
-
182
-
183
-
184
-
185
-
186
-
187
-
188
-
189
-
190
-
191
-
192
-
193
-
194
-
195
-
196
-
197
-
198
-
199
-
200
-
201
-
202
-
203
-
204
-
205
-
206
-
207
-
208
-
209
-
210
-
211
-
212
-
213
-
214
-
215
-
216
-
217
-
218
-
219
-
220
-
221
-
222
-
223
-
224
-
225
-
226
-
227
-
228
-
229
-
230
-
231
-
232
-
233
-
234
-
235
-
236
-
237
-
238
-
239
-
240
-
241
-
242
-
243
-
244
-
245
-
246
-
247
-
248
-
249
-
250
-
251
-
252
-
253
-
254
-
255
-
256
-
257
-
258
-
259
-
260
-
261
-
262
-
263
-
264
-
265
-
266
-
267
-
268
-
269
-
270
-
271
-
272
-
273
-
274
-
275
-
276
-
277
-
278
-
279
-
280
-
281
-
282
-
283
-
284
-
285
-
286
-
287
-
288
-
289
-
290
-
291
-
292
-
293
-
294
-
295
-
296
-
297
-
298
-
299
-
300
-
301
-
302
 |
 |
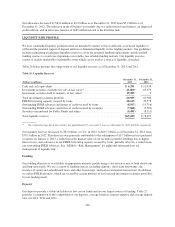
Market Risk Management
We employ several techniques to manage our interest rate and foreign exchange risk, which include, but are not
limited to, altering the duration and re-pricing characteristics of our various assets and liabilities through interest
rate derivatives. Derivatives are one of the primary tools we use in managing interest rate and foreign exchange
risk. Our current asset/liability management policy includes the use of derivatives to hedge material foreign
currency denominated transactions to limit our earnings exposure to foreign exchange risk. We execute our
derivative contracts in both over-the-counter and exchange-traded derivative markets. Although the majority of
our derivatives are interest rate swaps, we also use a variety of other derivative instruments, including caps,
floors, options, futures and forward contracts, to manage both our interest rate and foreign currency risk. The
outstanding notional amount of our derivative contracts totaled $63.4 billion as of December 31, 2013, compared
with $57.8 billion as of December 31, 2012.
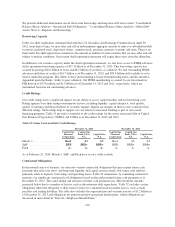
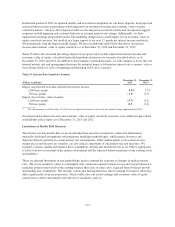
Market Risk Measurement
We have prescribed risk management policies and limits established by our Market and Liquidity Risk Policy
and approved by the Board of Directors. Our objective is to manage our asset/liability risk position and exposure
to market risk in accordance with these policies and prescribed limits based on prevailing market conditions and
long-term expectations. Because no single measure can reflect all aspects of market risk, we use various industry
standard market risk measurement techniques and analyses to measure, assess and manage the impact of changes
in interest rates and foreign exchange rates on our net interest income and our economic value of equity. See
“MD&A—Economic Value of Equity”.
We consider the impact on both net interest income and economic value of equity in measuring and managing
our interest rate risk. Because the federal funds rate was lowered to near zero in December 2008 and since then
has remained in a target range of zero to 0.25%, we use a 50 basis point decrease as our declining interest rate
scenario, since a scenario where interest rates would decline by 200 basis points is not plausible. In scenarios
where a 50 basis point decline would result in a rate less than 0%, we assume a rate of 0%. Below we discuss the
assumptions used in calculating each of these measures.
Net Interest Income Sensitivity
Our net interest income sensitivity measure estimates the impact on our projected 12-month base-line adjusted
net interest income resulting from movements in interest rates. Adjusted net interest income consists of net
interest income and changes in the fair value of mortgage servicing rights, including related derivative hedging
activity, and changes in the fair value of free-standing interest rate swaps. In addition to our existing assets and
liabilities, we incorporate expected future business growth assumptions, such as loan and deposit growth and
pricing, and plans for projected changes in our funding mix in our baseline forecast. In measuring the sensitivity
of interest rate movements on our adjusted projected net interest income, we assume an instantaneous plus 200
basis point and minus 50 basis point shock, with the lower rate scenario limited to zero as described above.
Economic Value of Equity
Our economic value of equity sensitivity measure estimates the impact on the net present value of our assets and
liabilities, including derivative hedging activity, resulting from movements in interest rates. Our economic value
of equity sensitivity measures are calculated based on our existing assets and liabilities, including derivatives,
and do not incorporate business growth assumptions or projected plans for funding mix changes. In measuring
the sensitivity of interest rate movements on our economic value of equity, we assume a hypothetical
instantaneous parallel shift in the level of interest rates of plus 200 basis points and minus 50 basis points to spot
rates.
112