Capital One 2013 Annual Report Download - page 77
Download and view the complete annual report
Please find page 77 of the 2013 Capital One annual report below. You can navigate through the pages in the report by either clicking on the pages listed below, or by using the keyword search tool below to find specific information within the annual report.-
 1
1 -
2
-
3
-
4
-
5
-
6
-
7
-
8
-
9
-
10
-
11
-
12
-
13
-
14
-
15
-
16
-
17
-
18
-
19
-
20
-
21
-
22
-
23
-
24
-
25
-
26
-
27
-
28
-
29
-
30
-
31
-
32
-
33
-
34
-
35
-
36
-
37
-
38
-
39
-
40
-
41
-
42
-
43
-
44
-
45
-
46
-
47
-
48
-
49
-
50
-
51
-
52
-
53
-
54
-
55
-
56
-
57
-
58
-
59
-
60
-
61
-
62
-
63
-
64
-
65
-
66
-
 67
67 -
 68
68 -
 69
69 -
 70
70 -
 71
71 -
 72
72 -
 73
73 -
 74
74 -
 75
75 -
 76
76 -
 77
77 -
 78
78 -
 79
79 -
 80
80 -
 81
81 -
 82
82 -
 83
83 -
 84
84 -
 85
85 -
 86
86 -
 87
87 -
88
-
89
-
90
-
91
-
92
-
93
-
94
-
95
-
96
-
97
-
98
-
99
-
100
-
101
-
102
-
103
-
104
-
105
-
106
-
107
-
108
-
109
-
110
-
111
-
112
-
113
-
114
-
115
-
116
-
117
-
118
-
119
-
120
-
121
-
122
-
123
-
124
-
125
-
126
-
127
-
128
-
129
-
130
-
131
-
132
-
133
-
134
-
135
-
136
-
137
-
138
-
139
-
140
-
141
-
142
-
143
-
144
-
145
-
146
-
147
-
148
-
149
-
150
-
151
-
152
-
153
-
154
-
155
-
156
-
157
-
158
-
159
-
160
-
161
-
162
-
163
-
164
-
165
-
166
-
167
-
168
-
169
-
170
-
171
-
172
-
173
-
174
-
175
-
176
-
177
-
178
-
179
-
180
-
181
-
182
-
183
-
184
-
185
-
186
-
187
-
188
-
189
-
190
-
191
-
192
-
193
-
194
-
195
-
196
-
197
-
198
-
199
-
200
-
201
-
202
-
203
-
204
-
205
-
206
-
207
-
208
-
209
-
210
-
211
-
212
-
213
-
214
-
215
-
216
-
217
-
218
-
219
-
220
-
221
-
222
-
223
-
224
-
225
-
226
-
227
-
228
-
229
-
230
-
231
-
232
-
233
-
234
-
235
-
236
-
237
-
238
-
239
-
240
-
241
-
242
-
243
-
244
-
245
-
246
-
247
-
248
-
249
-
250
-
251
-
252
-
253
-
254
-
255
-
256
-
257
-
258
-
259
-
260
-
261
-
262
-
263
-
264
-
265
-
266
-
267
-
268
-
269
-
270
-
271
-
272
-
273
-
274
-
275
-
276
-
277
-
278
-
279
-
280
-
281
-
282
-
283
-
284
-
285
-
286
-
287
-
288
-
289
-
290
-
291
-
292
-
293
-
294
-
295
-
296
-
297
-
298
-
299
-
300
-
301
-
302
 |
 |

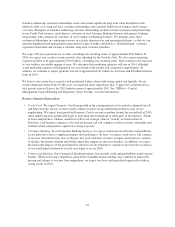
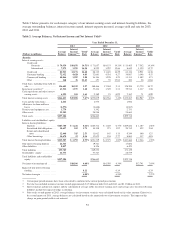
Table 2 below presents, for each major category of our interest-earning assets and interest-bearing liabilities, the
average outstanding balances, interest income earned, interest expense incurred, average yield and rate for 2013,
2012 and 2011.
Table 2: Average Balances, Net Interest Income and Net Interest Yield(1)
Year Ended December 31,
2013 2012 2011
(Dollars in millions)
Average
Balance
Interest
Income/
Expense(2)(3)
Yield/
Rate
Average
Balance
Interest
Income/
Expense(2)(3)
Yield/
Rate
Average
Balance
Interest
Income/
Expense(2)(3)
Yield/
Rate
Assets:
Interest-earning assets:
Credit card:
Domestic ............. $ 74,950 $10,876 14.51% $ 71,857 $10,153 14.13% $ 53,465 $ 7,562 14.14%
International ........... 7,973 1,295 16.24 8,255 1,292 15.66 8,645 1,359 15.72
Credit card ................ 82,923 12,171 14.68 80,112 11,445 14.29 62,110 8,921 14.36
Consumer banking .......... 72,652 4,428 6.09 72,061 4,516 6.27 34,967 3,348 9.57
Commercial banking ........ 40,866 1,587 3.88 36,136 1,528 4.23 31,311 1,482 4.73
Other .................... 168 36 21.43 157 55 35.03 202 28 13.86
Total loans, including loans held for
sale ........................ 196,609 18,222 9.27 188,466 17,544 9.31 128,590 13,779 10.72
Investment securities(4) .......... 63,522 1,575 2.48 57,424 1,329 2.31 39,513 1,137 2.88
Cash equivalents and other interest-
earning assets ................ 6,292 101 1.61 9,189 91 0.99 7,162 71 0.99
Total interest-earning assets ...... $266,423 $19,898 7.47% $255,079 $18,964 7.43% $175,265 $14,987 8.55%
Cash and due from banks ......... 2,461 4,573 1,926
Allowance for loan and lease
losses ...................... (4,572) (4,640) (4,865)
Premises and equipment, net ...... 3,770 3,342 2,731
Other assets ................... 29,202 28,248 24,661
Total assets .................... $297,284 $286,602 $199,718
Liabilities and stockholders’ equity:
Interest-bearing liabilities:
Deposits .................. $187,700 $ 1,241 0.66% $183,314 $ 1,403 0.77% $109,644 $ 1,187 1.08%
Securitized debt obligations . . . 10,697 183 1.71 14,138 271 1.92 20,715 422 2.04
Senior and subordinated
notes ................... 12,440 315 2.53 11,012 345 3.13 9,244 300 3.25
Other borrowings ........... 14,670 53 0.36 12,875 356 2.77 8,063 337 4.18
Total interest-bearing liabilities .... $225,507 $ 1,792 0.79% $221,339 $ 2,375 1.07% $147,666 $ 2,246 1.52%
Non-interest bearing deposits ..... 21,345 19,741 17,050
Other liabilities ................ 8,857 8,196 6,423
Total liabilities ................. 255,709 249,275 171,139
Stockholders’ equity ............ 41,575 37,327 28,579
Total liabilities and stockholders’
equity ...................... $297,284 $286,602 $199,718
Net interest income/spread ....... $18,106 6.68% $16,589 6.36% $12,741 7.03%
Impact of non-interest bearing
funding ..................... 0.12 0.14 0.24
Net interest margin ............. 6.80% 6.50% 7.27%
(1) Certain prior period amounts have been reclassified to conform to the current period presentation.
(2) Past due fees included in interest income totaled approximately $1.7 billion in both 2013 and 2012, and $1.1 billion in 2011.
(3) Interest income and interest expense and the calculation of average yields on interest-earning assets and average rates on interest-bearing
liabilities include the impact of hedge accounting.
(4) Prior to the second quarter of 2013, average balances for investment securities were calculated based on fair value amounts. Effective in
the second quarter of 2013, average balances are calculated based on the amortized cost of investment securities. The impact of this
change on prior period yields is not material.
57