Capital One 2013 Annual Report Download - page 218
Download and view the complete annual report
Please find page 218 of the 2013 Capital One annual report below. You can navigate through the pages in the report by either clicking on the pages listed below, or by using the keyword search tool below to find specific information within the annual report.-
 1
1 -
2
-
3
-
4
-
5
-
6
-
7
-
8
-
9
-
10
-
11
-
12
-
13
-
14
-
15
-
16
-
17
-
18
-
19
-
20
-
21
-
22
-
23
-
24
-
25
-
26
-
27
-
28
-
29
-
30
-
31
-
32
-
33
-
34
-
35
-
36
-
37
-
38
-
39
-
40
-
41
-
42
-
43
-
44
-
45
-
46
-
47
-
48
-
49
-
50
-
51
-
52
-
53
-
54
-
55
-
56
-
57
-
58
-
59
-
60
-
61
-
62
-
63
-
64
-
65
-
66
-
67
-
68
-
69
-
70
-
71
-
72
-
73
-
74
-
75
-
76
-
77
-
78
-
79
-
80
-
81
-
82
-
83
-
84
-
85
-
86
-
87
-
88
-
89
-
90
-
91
-
92
-
93
-
94
-
95
-
96
-
97
-
98
-
99
-
100
-
101
-
102
-
103
-
104
-
105
-
106
-
107
-
108
-
109
-
110
-
111
-
112
-
113
-
114
-
115
-
116
-
117
-
118
-
119
-
120
-
121
-
122
-
123
-
124
-
125
-
126
-
127
-
128
-
129
-
130
-
131
-
132
-
133
-
134
-
135
-
136
-
137
-
138
-
139
-
140
-
141
-
142
-
143
-
144
-
145
-
146
-
147
-
148
-
149
-
150
-
151
-
152
-
153
-
154
-
155
-
156
-
157
-
158
-
159
-
160
-
161
-
162
-
163
-
164
-
165
-
166
-
167
-
168
-
169
-
170
-
171
-
172
-
173
-
174
-
175
-
176
-
177
-
178
-
179
-
180
-
181
-
182
-
183
-
184
-
185
-
186
-
187
-
188
-
189
-
190
-
191
-
192
-
193
-
194
-
195
-
196
-
197
-
198
-
199
-
200
-
201
-
202
-
203
-
204
-
205
-
206
-
207
-
 208
208 -
 209
209 -
 210
210 -
 211
211 -
 212
212 -
 213
213 -
 214
214 -
 215
215 -
 216
216 -
 217
217 -
 218
218 -
 219
219 -
 220
220 -
 221
221 -
 222
222 -
 223
223 -
 224
224 -
 225
225 -
 226
226 -
 227
227 -
 228
228 -
229
-
230
-
231
-
232
-
233
-
234
-
235
-
236
-
237
-
238
-
239
-
240
-
241
-
242
-
243
-
244
-
245
-
246
-
247
-
248
-
249
-
250
-
251
-
252
-
253
-
254
-
255
-
256
-
257
-
258
-
259
-
260
-
261
-
262
-
263
-
264
-
265
-
266
-
267
-
268
-
269
-
270
-
271
-
272
-
273
-
274
-
275
-
276
-
277
-
278
-
279
-
280
-
281
-
282
-
283
-
284
-
285
-
286
-
287
-
288
-
289
-
290
-
291
-
292
-
293
-
294
-
295
-
296
-
297
-
298
-
299
-
300
-
301
-
302
 |
 |

CAPITAL ONE FINANCIAL CORPORATION
NOTES TO CONSOLIDATED FINANCIAL STATEMENTS—(Continued)
preferred stock; and capital that was reserved for dividends and share buy-backs that occurred during the fourth
quarter of 2013. The remaining equity, which represented approximately 5% of our total equity, is reserved for
potential future capital needs.
We will continue to regularly monitor our market capitalization and capital allocations in 2014, overall economic
conditions and other events or circumstances that may result in an impairment of goodwill in the future.
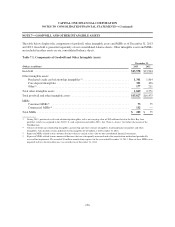
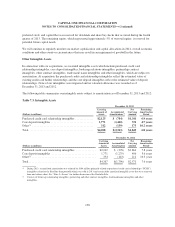
Other Intangible Assets
In connection with our acquisitions, we recorded intangible assets which include purchased credit card
relationship intangibles, core deposit intangibles, brokerage relations intangibles, partnership contract
intangibles, other contract intangibles, trade mark/ name intangibles and other intangibles, which are subject to
amortization. At acquisition, the purchased credit card relationship intangibles reflect the estimated value of
existing credit card holder relationships and the core deposit intangibles reflect the estimated value of deposit
relationships. None of our intangibles were impaired and no valuation allowance was recorded as of
December 31, 2013 and 2012.
The following table summarizes our intangible assets subject to amortization as of December 31, 2013 and 2012:
Table 7.3: Intangible Assets
December 31, 2013
(Dollars in millions)
Carrying
Amount of
Assets
Accumulated
Amortization (1)
Net
Carrying
Amount
Remaining
Amortization
Period
Purchased credit card relationship intangibles ............. $2,125 $ (784) $1,341 6.9 years
Core deposit intangibles .............................. 1,771 (1,440) 331 4.7 years
Other(2) ........................................... 312 (139) 173 10.2 years
Total. ............................................ $4,208 $(2,363) $1,845 6.8 years
December 31, 2012
(Dollars in millions)
Carrying
Amount of
Assets
Accumulated
Amortization
Net
Carrying
Amount
Remaining
Amortization
Period
Purchased credit card relationship intangibles .............. $2,242 $ (378) $1,864 7.8 years
Core deposit intangibles ............................... 1,771 (1,275) 496 5.6 years
Other(2) ............................................. 354 (143) 211 10.3 years
Total ............................................... $4,367 $(1,796) $2,571 7.6 years
(1) During 2013, accumulated amortization was reduced by $104 million primarily related to purchased credit card relationships (“PCCR”)
intangibles related to the Best Buy loan portfolio which was sold in 2013 and certain fully amortized intangible assets that were removed
from our balance sheet. See “Note 4—Loans” for further discussion of the Portfolio Sale.
(2) Consists of brokerage relationship intangibles, partnership and other contract intangibles, trademark/name intangibles and other
intangibles.
198