Capital One 2013 Annual Report Download - page 251
Download and view the complete annual report
Please find page 251 of the 2013 Capital One annual report below. You can navigate through the pages in the report by either clicking on the pages listed below, or by using the keyword search tool below to find specific information within the annual report.-
 1
1 -
2
-
3
-
4
-
5
-
6
-
7
-
8
-
9
-
10
-
11
-
12
-
13
-
14
-
15
-
16
-
17
-
18
-
19
-
20
-
21
-
22
-
23
-
24
-
25
-
26
-
27
-
28
-
29
-
30
-
31
-
32
-
33
-
34
-
35
-
36
-
37
-
38
-
39
-
40
-
41
-
42
-
43
-
44
-
45
-
46
-
47
-
48
-
49
-
50
-
51
-
52
-
53
-
54
-
55
-
56
-
57
-
58
-
59
-
60
-
61
-
62
-
63
-
64
-
65
-
66
-
67
-
68
-
69
-
70
-
71
-
72
-
73
-
74
-
75
-
76
-
77
-
78
-
79
-
80
-
81
-
82
-
83
-
84
-
85
-
86
-
87
-
88
-
89
-
90
-
91
-
92
-
93
-
94
-
95
-
96
-
97
-
98
-
99
-
100
-
101
-
102
-
103
-
104
-
105
-
106
-
107
-
108
-
109
-
110
-
111
-
112
-
113
-
114
-
115
-
116
-
117
-
118
-
119
-
120
-
121
-
122
-
123
-
124
-
125
-
126
-
127
-
128
-
129
-
130
-
131
-
132
-
133
-
134
-
135
-
136
-
137
-
138
-
139
-
140
-
141
-
142
-
143
-
144
-
145
-
146
-
147
-
148
-
149
-
150
-
151
-
152
-
153
-
154
-
155
-
156
-
157
-
158
-
159
-
160
-
161
-
162
-
163
-
164
-
165
-
166
-
167
-
168
-
169
-
170
-
171
-
172
-
173
-
174
-
175
-
176
-
177
-
178
-
179
-
180
-
181
-
182
-
183
-
184
-
185
-
186
-
187
-
188
-
189
-
190
-
191
-
192
-
193
-
194
-
195
-
196
-
197
-
198
-
199
-
200
-
201
-
202
-
203
-
204
-
205
-
206
-
207
-
208
-
209
-
210
-
211
-
212
-
213
-
214
-
215
-
216
-
217
-
218
-
219
-
220
-
221
-
222
-
223
-
224
-
225
-
226
-
227
-
228
-
229
-
230
-
231
-
232
-
233
-
234
-
235
-
236
-
237
-
238
-
239
-
240
-
 241
241 -
 242
242 -
 243
243 -
 244
244 -
 245
245 -
 246
246 -
 247
247 -
 248
248 -
 249
249 -
 250
250 -
 251
251 -
 252
252 -
 253
253 -
 254
254 -
 255
255 -
 256
256 -
 257
257 -
 258
258 -
 259
259 -
 260
260 -
 261
261 -
262
-
263
-
264
-
265
-
266
-
267
-
268
-
269
-
270
-
271
-
272
-
273
-
274
-
275
-
276
-
277
-
278
-
279
-
280
-
281
-
282
-
283
-
284
-
285
-
286
-
287
-
288
-
289
-
290
-
291
-
292
-
293
-
294
-
295
-
296
-
297
-
298
-
299
-
300
-
301
-
302
 |
 |

CAPITAL ONE FINANCIAL CORPORATION
NOTES TO CONSOLIDATED FINANCIAL STATEMENTS—(Continued)
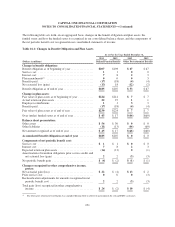
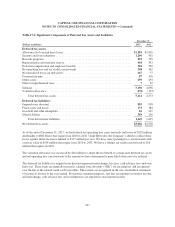
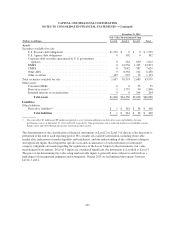
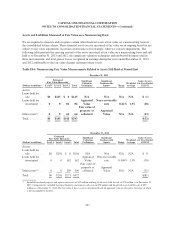
Assets and Liabilities Measured at Fair Value on a Recurring Basis
The following table displays our assets and liabilities measured on our consolidated balance sheets at fair value
on a recurring basis as of December 31, 2013 and 2012:
Table 18.1: Assets and Liabilities Measured at Fair Value on a Recurring Basis
December 31, 2013
Fair Value Measurements Using
(Dollars in millions) Level 1 Level 2 Level 3 Total
Assets
Securities available for sale:
U.S. Treasury debt obligations .............................. $833 $ 0 $ 0 $ 833
U.S. Agency debt obligations ............................... 0 10 1
Corporate debt securities guaranteed by U.S. government
agencies .............................................. 0 307 927 1,234
RMBS ................................................. 0 23,775 1,304 25,079
CMBS ................................................. 0 5,267 739 6,006
Other ABS .............................................. 0 6,793 343 7,136
Other securities .......................................... 127 1,367 17 1,511
Total securities available for sale ................................ 960 37,510 3,330 41,800
Other assets:
Consumer MSRs ......................................... 0 4 69 73
Derivative assets(1) ........................................ 3 906 50 959
Retained interests in securitizations .......................... 0 0 199 199
Total assets ......................................... $963 $38,420 $3,648 $43,031
Liabilities
Other liabilities:
Derivative liabilities(1) ..................................... $ 4 $ 668 $ 38 $ 710
Total liabilities ...................................... $ 4 $ 668 $ 38 $ 710
231