Capital One 2013 Annual Report Download - page 180
Download and view the complete annual report
Please find page 180 of the 2013 Capital One annual report below. You can navigate through the pages in the report by either clicking on the pages listed below, or by using the keyword search tool below to find specific information within the annual report.-
 1
1 -
2
-
3
-
4
-
5
-
6
-
7
-
8
-
9
-
10
-
11
-
12
-
13
-
14
-
15
-
16
-
17
-
18
-
19
-
20
-
21
-
22
-
23
-
24
-
25
-
26
-
27
-
28
-
29
-
30
-
31
-
32
-
33
-
34
-
35
-
36
-
37
-
38
-
39
-
40
-
41
-
42
-
43
-
44
-
45
-
46
-
47
-
48
-
49
-
50
-
51
-
52
-
53
-
54
-
55
-
56
-
57
-
58
-
59
-
60
-
61
-
62
-
63
-
64
-
65
-
66
-
67
-
68
-
69
-
70
-
71
-
72
-
73
-
74
-
75
-
76
-
77
-
78
-
79
-
80
-
81
-
82
-
83
-
84
-
85
-
86
-
87
-
88
-
89
-
90
-
91
-
92
-
93
-
94
-
95
-
96
-
97
-
98
-
99
-
100
-
101
-
102
-
103
-
104
-
105
-
106
-
107
-
108
-
109
-
110
-
111
-
112
-
113
-
114
-
115
-
116
-
117
-
118
-
119
-
120
-
121
-
122
-
123
-
124
-
125
-
126
-
127
-
128
-
129
-
130
-
131
-
132
-
133
-
134
-
135
-
136
-
137
-
138
-
139
-
140
-
141
-
142
-
143
-
144
-
145
-
146
-
147
-
148
-
149
-
150
-
151
-
152
-
153
-
154
-
155
-
156
-
157
-
158
-
159
-
160
-
161
-
162
-
163
-
164
-
165
-
166
-
167
-
168
-
169
-
 170
170 -
 171
171 -
 172
172 -
 173
173 -
 174
174 -
 175
175 -
 176
176 -
 177
177 -
 178
178 -
 179
179 -
 180
180 -
 181
181 -
 182
182 -
 183
183 -
 184
184 -
 185
185 -
 186
186 -
 187
187 -
 188
188 -
 189
189 -
 190
190 -
191
-
192
-
193
-
194
-
195
-
196
-
197
-
198
-
199
-
200
-
201
-
202
-
203
-
204
-
205
-
206
-
207
-
208
-
209
-
210
-
211
-
212
-
213
-
214
-
215
-
216
-
217
-
218
-
219
-
220
-
221
-
222
-
223
-
224
-
225
-
226
-
227
-
228
-
229
-
230
-
231
-
232
-
233
-
234
-
235
-
236
-
237
-
238
-
239
-
240
-
241
-
242
-
243
-
244
-
245
-
246
-
247
-
248
-
249
-
250
-
251
-
252
-
253
-
254
-
255
-
256
-
257
-
258
-
259
-
260
-
261
-
262
-
263
-
264
-
265
-
266
-
267
-
268
-
269
-
270
-
271
-
272
-
273
-
274
-
275
-
276
-
277
-
278
-
279
-
280
-
281
-
282
-
283
-
284
-
285
-
286
-
287
-
288
-
289
-
290
-
291
-
292
-
293
-
294
-
295
-
296
-
297
-
298
-
299
-
300
-
301
-
302
 |
 |

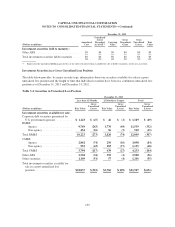
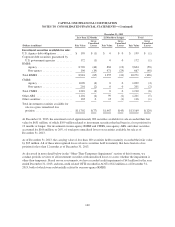
CAPITAL ONE FINANCIAL CORPORATION
NOTES TO CONSOLIDATED FINANCIAL STATEMENTS—(Continued)
December 31, 2012
Less than 12 Months 12 Months or Longer Total
(Dollars in millions) Fair Value
Gross
Unrealized
Losses Fair Value
Gross
Unrealized
Losses Fair Value
Gross
Unrealized
Losses
Investment securities available for sale:
U.S. Agency debt obligations ........... $ 199 $ (1) $ 0 $ 0 $ 199 $ (1)
Corporate debt securities guaranteed by
U.S. government agencies ........... 172 (1) 0 0 172 (1)
RMBS:
Agency ........................ 8,720 (46) 884 (12) 9,604 (58)
Non-agency ..................... 196 (19) 471 (29) 667 (48)
Total RMBS ........................ 8,916 (65) 1,355 (41) 10,271 (106)
CMBS:
Agency ........................ 1,009 (4) 0 0 1,009 (4)
Non-agency ..................... 201 (2) 0 0 201 (2)
Total CMBS ........................ 1,210 (6) 0 0 1,210 (6)
Other ABS ......................... 1,102 (4) 99 (1) 1,201 (5)
Other securities ...................... 103 0 13 (1) 116 (1)
Total investment securities available for
sale in a gross unrealized loss
position .......................... $11,702 $(77) $1,467 $(43) $13,169 $(120)
At December 31, 2013, the amortized cost of approximately 900 securities available for sale exceeded their fair
value by $631 million, of which $109 million related to investment securities that had been in a loss position for
12 months or longer. Our investments in non-agency RMBS and CMBS, non-agency ABS, and other securities
accounted for $166 million, or 26%, of total gross unrealized losses on securities available for sale as of
December 31, 2013.
As of December 31, 2013, the carrying value of less than 100 securities held to maturity exceeded their fair value
by $35 million. All of these unrecognized losses relate to securities held to maturity that have been in a loss
position for less than 12 months as of December 31, 2013.
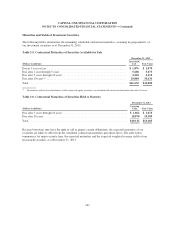
As discussed in more detail below in the “Other-Than-Temporary Impairment” section of this footnote, we
conduct periodic reviews of all investment securities with unrealized losses to assess whether the impairment is
other-than-temporary. Based on our assessments, we have recorded credit impairment of $41 million for the year
ended December 31, 2013, and non-credit related OTTI recorded in AOCI of $12 million as of December 31,
2013, both of which were substantially related to our non-agency RMBS.
160