Capital One 2013 Annual Report Download - page 260
Download and view the complete annual report
Please find page 260 of the 2013 Capital One annual report below. You can navigate through the pages in the report by either clicking on the pages listed below, or by using the keyword search tool below to find specific information within the annual report.-
 1
1 -
2
-
3
-
4
-
5
-
6
-
7
-
8
-
9
-
10
-
11
-
12
-
13
-
14
-
15
-
16
-
17
-
18
-
19
-
20
-
21
-
22
-
23
-
24
-
25
-
26
-
27
-
28
-
29
-
30
-
31
-
32
-
33
-
34
-
35
-
36
-
37
-
38
-
39
-
40
-
41
-
42
-
43
-
44
-
45
-
46
-
47
-
48
-
49
-
50
-
51
-
52
-
53
-
54
-
55
-
56
-
57
-
58
-
59
-
60
-
61
-
62
-
63
-
64
-
65
-
66
-
67
-
68
-
69
-
70
-
71
-
72
-
73
-
74
-
75
-
76
-
77
-
78
-
79
-
80
-
81
-
82
-
83
-
84
-
85
-
86
-
87
-
88
-
89
-
90
-
91
-
92
-
93
-
94
-
95
-
96
-
97
-
98
-
99
-
100
-
101
-
102
-
103
-
104
-
105
-
106
-
107
-
108
-
109
-
110
-
111
-
112
-
113
-
114
-
115
-
116
-
117
-
118
-
119
-
120
-
121
-
122
-
123
-
124
-
125
-
126
-
127
-
128
-
129
-
130
-
131
-
132
-
133
-
134
-
135
-
136
-
137
-
138
-
139
-
140
-
141
-
142
-
143
-
144
-
145
-
146
-
147
-
148
-
149
-
150
-
151
-
152
-
153
-
154
-
155
-
156
-
157
-
158
-
159
-
160
-
161
-
162
-
163
-
164
-
165
-
166
-
167
-
168
-
169
-
170
-
171
-
172
-
173
-
174
-
175
-
176
-
177
-
178
-
179
-
180
-
181
-
182
-
183
-
184
-
185
-
186
-
187
-
188
-
189
-
190
-
191
-
192
-
193
-
194
-
195
-
196
-
197
-
198
-
199
-
200
-
201
-
202
-
203
-
204
-
205
-
206
-
207
-
208
-
209
-
210
-
211
-
212
-
213
-
214
-
215
-
216
-
217
-
218
-
219
-
220
-
221
-
222
-
223
-
224
-
225
-
226
-
227
-
228
-
229
-
230
-
231
-
232
-
233
-
234
-
235
-
236
-
237
-
238
-
239
-
240
-
241
-
242
-
243
-
244
-
245
-
246
-
247
-
248
-
249
-
 250
250 -
 251
251 -
 252
252 -
 253
253 -
 254
254 -
 255
255 -
 256
256 -
 257
257 -
 258
258 -
 259
259 -
 260
260 -
 261
261 -
 262
262 -
 263
263 -
 264
264 -
 265
265 -
 266
266 -
 267
267 -
 268
268 -
 269
269 -
 270
270 -
271
-
272
-
273
-
274
-
275
-
276
-
277
-
278
-
279
-
280
-
281
-
282
-
283
-
284
-
285
-
286
-
287
-
288
-
289
-
290
-
291
-
292
-
293
-
294
-
295
-
296
-
297
-
298
-
299
-
300
-
301
-
302
 |
 |
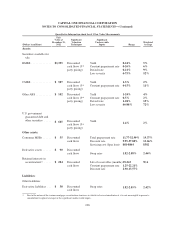
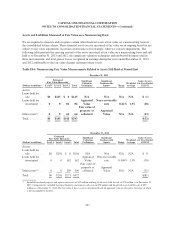
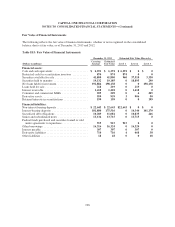
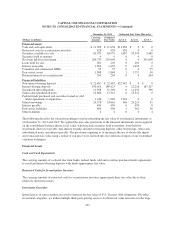
CAPITAL ONE FINANCIAL CORPORATION
NOTES TO CONSOLIDATED FINANCIAL STATEMENTS—(Continued)
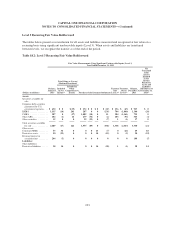
majority of our securities. A pricing service may be considered as the primary pricing provider for certain types
of securities, and the designation of the primary pricing provider may vary depending on the type of securities.
The determination of the primary pricing provider is based on our experience and validation benchmark of the
pricing service’s performance in terms of providing fair value measurement for the various types of securities.
Certain securities are classified as Level 2 and 3, the majority of which are collateralized mortgage obligations
and mortgage-backed securities. Level 2 and 3 classifications indicate that significant valuation assumptions are
not consistently observable in the market. When significant assumptions are not consistently observable, fair
values are derived using the best available data. Such data may include quotes provided by a dealer, the use of
external pricing services, independent pricing models, or other model-based valuation techniques such as
calculation of the present values of future cash flows incorporating assumptions such as benchmark yields,
spreads, prepayment speeds, credit ratings, and losses. The techniques used by the pricing services utilize
observable market data to the extent available. Pricing models may be used, which can vary by asset class and
may incorporate available trade, bid and other market information. Across asset classes, information such as
trader/dealer input, credit spreads, forward curves, and prepayment speeds are used to help determine appropriate
valuations. Because many fixed income securities do not trade on a daily basis, the evaluated pricing applications
may apply available information through processes such as benchmarking curves, like securities, sector
groupings, and matrix pricing to prepare valuations. In addition, model processes are used by the pricing services
to develop prepayment and interest rate scenarios.
We validate the pricing obtained from the primary pricing providers through comparison of pricing to additional
sources, including other pricing services, dealer pricing indications in transaction results, and other internal
sources. Pricing variances among different pricing sources are analyzed and validated. Additionally, on an
on-going basis we may select a sample of securities and test the third-party valuation by obtaining more detailed
information about the pricing methodology, sources of information, and assumptions used to value the securities.
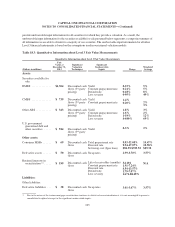
The significant unobservable inputs used in the fair value measurement of our residential, asset-backed and
commercial securities include yield, prepayment rate, default rate and loss severity in the event of default.
Significant increases (decreases) in any of those inputs in isolation or combination would result in a significant
change in fair value measurement. Generally, an increase in the yield assumption will result in a decrease in fair
value measurement, however, an increase or decrease in prepayment rate, default rate or loss severity may have a
different impact on the fair value given various characteristics of the security including the capital structure of
the deal, credit enhancement for the security or other factors.
There was a considerable decrease in the market value of our portfolio holdings as of December 31, 2013,
compared with December 31, 2012 due to higher interest rates.
Loans Held For Sale
Loans held for sale are carried at the lower of aggregate cost, net of deferred fees and deferred origination costs,
or fair value. We originate loans with the intent to sell to government sponsored enterprises as part of a delegated
underwriting and servicing (“DUS”) program. For DUS commercial loans, we believe the fair value
approximates par value as this is the contractual price we receive from the purchaser. For all other loans
classified as held for sale, the fair value is determined using a discounted cash flow model or current secondary
market prices for loan pools with similar characteristics. Loans held for sale that are valued at par or using a
discounted cash flow model are classified as Level 2. Fair value adjustments to loans held for sale are recorded in
other non-interest income in our consolidated statements of income.
240