Capital One 2013 Annual Report Download - page 61
Download and view the complete annual report
Please find page 61 of the 2013 Capital One annual report below. You can navigate through the pages in the report by either clicking on the pages listed below, or by using the keyword search tool below to find specific information within the annual report.-
 1
1 -
2
-
3
-
4
-
5
-
6
-
7
-
8
-
9
-
10
-
11
-
12
-
13
-
14
-
15
-
16
-
17
-
18
-
19
-
20
-
21
-
22
-
23
-
24
-
25
-
26
-
27
-
28
-
29
-
30
-
31
-
32
-
33
-
34
-
35
-
36
-
37
-
38
-
39
-
40
-
41
-
42
-
43
-
44
-
45
-
46
-
47
-
48
-
49
-
50
-
 51
51 -
 52
52 -
 53
53 -
 54
54 -
 55
55 -
 56
56 -
 57
57 -
 58
58 -
 59
59 -
 60
60 -
 61
61 -
 62
62 -
 63
63 -
 64
64 -
 65
65 -
 66
66 -
 67
67 -
 68
68 -
 69
69 -
 70
70 -
 71
71 -
72
-
73
-
74
-
75
-
76
-
77
-
78
-
79
-
80
-
81
-
82
-
83
-
84
-
85
-
86
-
87
-
88
-
89
-
90
-
91
-
92
-
93
-
94
-
95
-
96
-
97
-
98
-
99
-
100
-
101
-
102
-
103
-
104
-
105
-
106
-
107
-
108
-
109
-
110
-
111
-
112
-
113
-
114
-
115
-
116
-
117
-
118
-
119
-
120
-
121
-
122
-
123
-
124
-
125
-
126
-
127
-
128
-
129
-
130
-
131
-
132
-
133
-
134
-
135
-
136
-
137
-
138
-
139
-
140
-
141
-
142
-
143
-
144
-
145
-
146
-
147
-
148
-
149
-
150
-
151
-
152
-
153
-
154
-
155
-
156
-
157
-
158
-
159
-
160
-
161
-
162
-
163
-
164
-
165
-
166
-
167
-
168
-
169
-
170
-
171
-
172
-
173
-
174
-
175
-
176
-
177
-
178
-
179
-
180
-
181
-
182
-
183
-
184
-
185
-
186
-
187
-
188
-
189
-
190
-
191
-
192
-
193
-
194
-
195
-
196
-
197
-
198
-
199
-
200
-
201
-
202
-
203
-
204
-
205
-
206
-
207
-
208
-
209
-
210
-
211
-
212
-
213
-
214
-
215
-
216
-
217
-
218
-
219
-
220
-
221
-
222
-
223
-
224
-
225
-
226
-
227
-
228
-
229
-
230
-
231
-
232
-
233
-
234
-
235
-
236
-
237
-
238
-
239
-
240
-
241
-
242
-
243
-
244
-
245
-
246
-
247
-
248
-
249
-
250
-
251
-
252
-
253
-
254
-
255
-
256
-
257
-
258
-
259
-
260
-
261
-
262
-
263
-
264
-
265
-
266
-
267
-
268
-
269
-
270
-
271
-
272
-
273
-
274
-
275
-
276
-
277
-
278
-
279
-
280
-
281
-
282
-
283
-
284
-
285
-
286
-
287
-
288
-
289
-
290
-
291
-
292
-
293
-
294
-
295
-
296
-
297
-
298
-
299
-
300
-
301
-
302
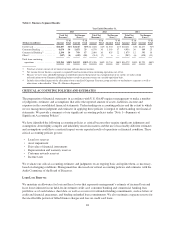
 |
 |

Change
Year Ended December 31, 2013 vs.
2012
2012 vs.
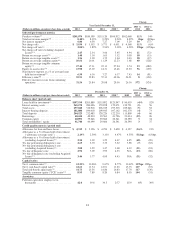
2011(Dollars in millions, except per share data as noted) 2013 2012 2011 2010(1) 2009
Selected performance metrics
Purchase volume(9) ...................... $201,074 $180,599 $135,120 $106,912 $102,068 11% 34%
Total net revenue margin(10) ............... 8.40% 8.39% 9.29% 9.20% 8.92% 1bps (90)bps
Net interest margin(11) .................... 6.80 6.50 7.27 7.09 5.29 30 (77)
Net charge-offs ......................... $ 3,934 $ 3,555 $ 3,771 $ 6,651 $ 4,568 11% (6)%
Net charge-off rate(12) .................... 2.04% 1.89% 2.94% 5.18% 4.58% 15bps (105)bps
Net charge-off rate (excluding Acquired
Loans)(13) ............................ 2.45 2.34 3.06 5.45 4.94 11 (72)
Return on average assets(14) ............... 1.48 1.30 1.63 1.52 0.58 18 (33)
Return on average tangible assets(15) ........ 1.56 1.38 1.75 1.64 0.63 18 (37)
Return on average common equity(16) ........ 10.61 10.01 11.29 12.23 1.68 60 (128)
Return on average tangible common
equity(17) ............................ 17.44 17.31 22.11 27.94 3.74 13 (480)
Equity-to-assets ratio(18) .................. 13.98 13.02 14.31 12.46 15.50 96 (129)
Non-interest expense as a % of average loans
held for investment(19) .................. 6.50 6.36 7.27 6.17 7.43 14 (91)
Efficiency ratio(20) ....................... 55.91 55.83 57.33 49.06 56.21 8(150)
Effective income tax rate from continuing
operations ........................... 31.56 25.84 29.08 29.56 26.16 572 (324)
Change
December 31, 2013 vs.
2012
2012 vs.
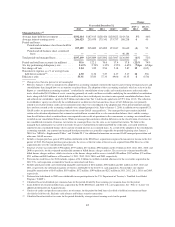
2011(Dollars in millions except per share data as noted) 2013 2012 2011 2010(1) 2009
Balance sheet (period end)
Loans held for investment(8) ............... $197,199 $205,889 $135,892 $125,947 $ 90,619 (4)% 52%
Interest-earning assets .................... 265,170 280,096 179,878 172,071 139,751 (5) 56
Total assets ............................ 297,048 312,918 206,019 197,503 169,646 (5) 52
Interest-bearing deposits. ................. 181,880 190,018 109,945 107,162 102,370 (4) 73
Total deposits .......................... 204,523 212,485 128,226 122,210 115,809 (4) 66
Borrowings ............................ 40,654 49,910 39,561 41,796 21,014 (19) 26
Common equity ........................ 40,891 39,646 29,666 26,541 26,590 334
Total stockholders’ equity. ................ 41,744 40,499 29,666 26,541 26,590 337
Credit quality metrics (period end)
Allowance for loan and lease losses ......... $ 4,315 $ 5,156 $ 4,250 $ 5,628 $ 4,127 (16)% 21%
Allowance as a % of loans held of investment
(“allowance coverage ratio”) ............ 2.19% 2.50% 3.13% 4.47% 4.55% (31)bps (63)bps
Allowance as a % of loans held of investment
(excluding Acquired Loans)(13) ........... 2.54 3.02 3.22 4.67 4.95 (48) (20)
30+ day performing delinquency rate ........ 2.63 2.70 3.35 3.52 3.98 (7) (65)
30+ day performing delinquency rate
(excluding Acquired Loans)(13) ........... 3.08 3.29 3.47 3.68 4.32 (21) (18)
30+ day delinquency rate ................. 2.96 3.09 3.95 4.23 N/A (13) (86)
30+ day delinquency rate (excluding Acquired
Loans)(13) ............................ 3.46 3.77 4.09 4.43 N/A (31) (32)
Capital ratios
Tier 1 common ratio(21) ................... 12.23% 10.96% 9.67% 8.77% 10.62% 127bps 129bps
Tier 1 risk-based capital ratio(22). ........... 12.61 11.34 12.01 11.63 13.75 127 (67)
Total risk-based capital ratio(23) . ........... 14.73 13.56 14.86 16.83 17.70 117 (130)
Tangible common equity (“TCE”) ratio(24) ... 8.93 7.89 8.20 6.84 8.03 104 (31)
Associates
Full-time equivalent employees (in
thousands) ........................... 42.0 39.6 30.5 25.7 25.9 6% 30%
41