Capital One 2013 Annual Report Download - page 209
Download and view the complete annual report
Please find page 209 of the 2013 Capital One annual report below. You can navigate through the pages in the report by either clicking on the pages listed below, or by using the keyword search tool below to find specific information within the annual report.-
 1
1 -
2
-
3
-
4
-
5
-
6
-
7
-
8
-
9
-
10
-
11
-
12
-
13
-
14
-
15
-
16
-
17
-
18
-
19
-
20
-
21
-
22
-
23
-
24
-
25
-
26
-
27
-
28
-
29
-
30
-
31
-
32
-
33
-
34
-
35
-
36
-
37
-
38
-
39
-
40
-
41
-
42
-
43
-
44
-
45
-
46
-
47
-
48
-
49
-
50
-
51
-
52
-
53
-
54
-
55
-
56
-
57
-
58
-
59
-
60
-
61
-
62
-
63
-
64
-
65
-
66
-
67
-
68
-
69
-
70
-
71
-
72
-
73
-
74
-
75
-
76
-
77
-
78
-
79
-
80
-
81
-
82
-
83
-
84
-
85
-
86
-
87
-
88
-
89
-
90
-
91
-
92
-
93
-
94
-
95
-
96
-
97
-
98
-
99
-
100
-
101
-
102
-
103
-
104
-
105
-
106
-
107
-
108
-
109
-
110
-
111
-
112
-
113
-
114
-
115
-
116
-
117
-
118
-
119
-
120
-
121
-
122
-
123
-
124
-
125
-
126
-
127
-
128
-
129
-
130
-
131
-
132
-
133
-
134
-
135
-
136
-
137
-
138
-
139
-
140
-
141
-
142
-
143
-
144
-
145
-
146
-
147
-
148
-
149
-
150
-
151
-
152
-
153
-
154
-
155
-
156
-
157
-
158
-
159
-
160
-
161
-
162
-
163
-
164
-
165
-
166
-
167
-
168
-
169
-
170
-
171
-
172
-
173
-
174
-
175
-
176
-
177
-
178
-
179
-
180
-
181
-
182
-
183
-
184
-
185
-
186
-
187
-
188
-
189
-
190
-
191
-
192
-
193
-
194
-
195
-
196
-
197
-
198
-
 199
199 -
 200
200 -
 201
201 -
 202
202 -
 203
203 -
 204
204 -
 205
205 -
 206
206 -
 207
207 -
 208
208 -
 209
209 -
 210
210 -
 211
211 -
 212
212 -
 213
213 -
 214
214 -
 215
215 -
 216
216 -
 217
217 -
 218
218 -
 219
219 -
220
-
221
-
222
-
223
-
224
-
225
-
226
-
227
-
228
-
229
-
230
-
231
-
232
-
233
-
234
-
235
-
236
-
237
-
238
-
239
-
240
-
241
-
242
-
243
-
244
-
245
-
246
-
247
-
248
-
249
-
250
-
251
-
252
-
253
-
254
-
255
-
256
-
257
-
258
-
259
-
260
-
261
-
262
-
263
-
264
-
265
-
266
-
267
-
268
-
269
-
270
-
271
-
272
-
273
-
274
-
275
-
276
-
277
-
278
-
279
-
280
-
281
-
282
-
283
-
284
-
285
-
286
-
287
-
288
-
289
-
290
-
291
-
292
-
293
-
294
-
295
-
296
-
297
-
298
-
299
-
300
-
301
-
302
 |
 |

CAPITAL ONE FINANCIAL CORPORATION
NOTES TO CONSOLIDATED FINANCIAL STATEMENTS—(Continued)
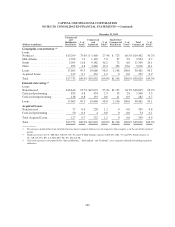
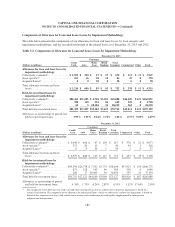
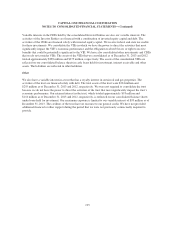
Components of Allowance for Loan and Lease Losses by Impairment Methodology
The table below presents the components of our allowance for loan and lease losses, by loan category and
impairment methodology, and the recorded investment of the related loans as of December 31, 2013 and 2012:
Table 5.2: Components of Allowance for Loan and Lease Losses by Impairment Methodology
December 31, 2013
Consumer
(Dollars in millions)
Credit
Card Auto
Home
Loan
Retail
Banking
Total
Consumer Commercial Other Total
Allowance for loan and lease losses by
impairment methodology:
Collectively evaluated(1) .............. $ 2,953 $ 590 $ 27 $ 53 $ 670 $ 313 $ 11 $ 3,947
Asset-specific(2) .................... 261 16 18 10 44 25 0 330
Acquired Loans(3) ................... 0 0 38 0 38 0 0 38
Total allowance for loan and lease
losses .......................... $ 3,214 $ 606 $ 83 $ 63 $ 752 $ 338 $ 11 $ 4,315
Held-for-investment loans by
impairment methodology:
Collectively evaluated(1) .............. $80,462 $31,683 $ 6,704 $3,501 $41,888 $44,420 $ 121 $166,891
Asset-specific(2) .................... 780 169 394 86 649 329 0 1,758
Acquired Loans(3) ................... 63 5 28,184 36 28,225 262 0 28,550
Total held-for-investment loans ........ $81,305 $31,857 $35,282 $3,623 $70,762 $45,011 $ 121 $197,199
Allowance as a percentage of period-end
held-for-investment loans ........... 3.95% 1.90% 0.24% 1.74% 1.06% 0.75% 9.09% 2.19%
December 31, 2012
Consumer
(Dollars in millions)
Credit
Card Auto
Home
Loan
Retail
Banking
Total
Consumer Commercial Other Total
Allowance for loan and lease losses by
impairment methodology:
Collectively evaluated(1) ............. $ 3,648 $ 466 $ 47 $ 104 $ 617 $ 376 $ 32 $ 4,673
Asset-specific(2) ................... 331 20 13 7 40 54 1 426
Acquired Loans(3) .................. 0 0 53 1 54 3 0 57
Total allowance for loan and lease
losses ......................... $ 3,979 $ 486 $ 113 $ 112 $ 711 $ 433 $ 33 $ 5,156
Held-for-investment loans by
impairment methodology:
Collectively evaluated(1) ............. $90,594 $26,778 $ 7,552 $3,774 $38,104 $37,923 $ 154 $166,775
Asset-specific(2) ................... 873 328 145 96 569 538 0 1,980
Acquired Loans(3) .................. 288 17 36,403 34 36,454 359 33 37,134
Total held-for-investment loans ....... $91,755 $27,123 $44,100 $3,904 $75,127 $38,820 $ 187 $205,889
Allowance as a percentage of period-
end held-for-investment loans ...... 4.34% 1.79% 0.26% 2.87% 0.95% 1.12% 17.65% 2.50%
(1) The component of the allowance for credit card and other consumer loans that we collectively evaluate for impairment is based on a
statistical calculation. The component of the allowance for commercial loans, which we collectively evaluate for impairment, is based on
historical loss experience for loans with similar characteristics and consideration of credit quality supplemented by management
judgment and interpretation.
189