Capital One 2013 Annual Report Download - page 120
Download and view the complete annual report
Please find page 120 of the 2013 Capital One annual report below. You can navigate through the pages in the report by either clicking on the pages listed below, or by using the keyword search tool below to find specific information within the annual report.-
 1
1 -
2
-
3
-
4
-
5
-
6
-
7
-
8
-
9
-
10
-
11
-
12
-
13
-
14
-
15
-
16
-
17
-
18
-
19
-
20
-
21
-
22
-
23
-
24
-
25
-
26
-
27
-
28
-
29
-
30
-
31
-
32
-
33
-
34
-
35
-
36
-
37
-
38
-
39
-
40
-
41
-
42
-
43
-
44
-
45
-
46
-
47
-
48
-
49
-
50
-
51
-
52
-
53
-
54
-
55
-
56
-
57
-
58
-
59
-
60
-
61
-
62
-
63
-
64
-
65
-
66
-
67
-
68
-
69
-
70
-
71
-
72
-
73
-
74
-
75
-
76
-
77
-
78
-
79
-
80
-
81
-
82
-
83
-
84
-
85
-
86
-
87
-
88
-
89
-
90
-
91
-
92
-
93
-
94
-
95
-
96
-
97
-
98
-
99
-
100
-
101
-
102
-
103
-
104
-
105
-
106
-
107
-
108
-
109
-
 110
110 -
 111
111 -
 112
112 -
 113
113 -
 114
114 -
 115
115 -
 116
116 -
 117
117 -
 118
118 -
 119
119 -
 120
120 -
 121
121 -
 122
122 -
 123
123 -
 124
124 -
 125
125 -
 126
126 -
 127
127 -
 128
128 -
 129
129 -
 130
130 -
131
-
132
-
133
-
134
-
135
-
136
-
137
-
138
-
139
-
140
-
141
-
142
-
143
-
144
-
145
-
146
-
147
-
148
-
149
-
150
-
151
-
152
-
153
-
154
-
155
-
156
-
157
-
158
-
159
-
160
-
161
-
162
-
163
-
164
-
165
-
166
-
167
-
168
-
169
-
170
-
171
-
172
-
173
-
174
-
175
-
176
-
177
-
178
-
179
-
180
-
181
-
182
-
183
-
184
-
185
-
186
-
187
-
188
-
189
-
190
-
191
-
192
-
193
-
194
-
195
-
196
-
197
-
198
-
199
-
200
-
201
-
202
-
203
-
204
-
205
-
206
-
207
-
208
-
209
-
210
-
211
-
212
-
213
-
214
-
215
-
216
-
217
-
218
-
219
-
220
-
221
-
222
-
223
-
224
-
225
-
226
-
227
-
228
-
229
-
230
-
231
-
232
-
233
-
234
-
235
-
236
-
237
-
238
-
239
-
240
-
241
-
242
-
243
-
244
-
245
-
246
-
247
-
248
-
249
-
250
-
251
-
252
-
253
-
254
-
255
-
256
-
257
-
258
-
259
-
260
-
261
-
262
-
263
-
264
-
265
-
266
-
267
-
268
-
269
-
270
-
271
-
272
-
273
-
274
-
275
-
276
-
277
-
278
-
279
-
280
-
281
-
282
-
283
-
284
-
285
-
286
-
287
-
288
-
289
-
290
-
291
-
292
-
293
-
294
-
295
-
296
-
297
-
298
-
299
-
300
-
301
-
302
 |
 |

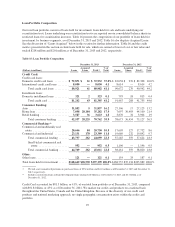
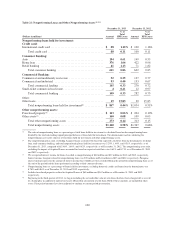
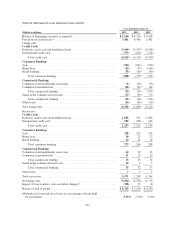
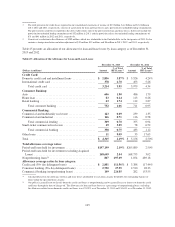
Table 21: Nonperforming Loans and Other Nonperforming Assets(1)(2)(3)
(Dollars in millions)
December 31, 2013 December 31, 2012
Amount
% of
Total
HFI Loans Amount
% of
Total
HFI Loans
Nonperforming loans held for investment:
Credit card:
International credit card ..................................... $ 88 1.10% $ 100 1.16%
Total credit card ....................................... 88 0.11 100 0.11
Consumer Banking:
Auto .................................................... 194 0.61 149 0.55
Home loan ............................................... 376 1.06 422 0.96
Retail banking ............................................ 41 1.13 71 1.82
Total consumer banking ................................ 611 0.86 642 0.85
Commercial Banking:
Commercial and multifamily real estate ........................ 52 0.25 137 0.77
Commercial and industrial .................................. 93 0.40 133 0.67
Total commercial lending ............................... 145 0.33 270 0.72
Small-ticket commercial real estate ............................ 4 0.41 12 0.97
Total commercial banking ............................... 149 0.33 282 0.73
Other:
Other loans ............................................... 19 15.83 30 15.85
Total nonperforming loans held for investment(4) ............. $ 867 0.44% $1,054 0.51%
Other nonperforming assets:
Foreclosed property(5) ...................................... $ 113 0.06% $ 204 0.10%
Other assets(6) ............................................. 160 0.08 109 0.05
Total other nonperforming assets ......................... 273 0.14 313 0.15
Total nonperforming assets .............................. $1,140 0.58% $1,367 0.66%
(1) The ratio of nonperforming loans as a percentage of total loans held for investment is calculated based on the nonperforming loans
divided by the total outstanding unpaid principal balance of loans held for investment. The denominator used in calculating the
nonperforming asset ratios consists of total loans held for investment and other nonperforming assets.
(2) The nonperforming loan ratio, excluding Acquired Loans accounted for based on expected cash flows from the denominator, for home
loan, total consumer banking, and total nonperforming loans held for investment was 5.29%, 1.44%, and 0.51%, respectively, as of
December 31, 2013, compared with 5.48%, 1.66%, and 0.62%, respectively, as of December 31, 2012. The nonperforming asset ratio,
excluding the impact of Acquired Loans accounted for based on expected cash flows was 0.63% and 0.71% as of December 31, 2013
and 2012, respectively.
(3) We recognized interest income for loans classified as nonperforming of $40 million and $32 million in 2013 and 2012, respectively.
Interest income foregone related to nonperforming loans was $55 million and $41 million in 2013 and 2012, respectively. Foregone
interest income represents the amount of interest income that would have been recorded during the period for nonperforming loans as of
the end of the period had the loans performed according to their contractual terms.
(4) Nonperforming loans as a percentage of loans held for investment, excluding domestic credit card loans from the denominator, was
0.70% and 0.86% as of December 31, 2013 and 2012, respectively.
(5) Includes foreclosed properties related to Acquired Loans of $68 million and $167 million as of December 31, 2013 and 2012,
respectively.
(6) Beginning in the third quarter of 2013, we began including the net realizable value of auto loans that have been charged-off as a result
of a bankruptcy in addition to repossessed assets obtained in satisfaction of auto loans. Both of these amounts are included in other
assets. Prior period amounts have been adjusted to conform to current period presentation.
100