Capital One 2013 Annual Report Download - page 88
Download and view the complete annual report
Please find page 88 of the 2013 Capital One annual report below. You can navigate through the pages in the report by either clicking on the pages listed below, or by using the keyword search tool below to find specific information within the annual report.-
 1
1 -
2
-
3
-
4
-
5
-
6
-
7
-
8
-
9
-
10
-
11
-
12
-
13
-
14
-
15
-
16
-
17
-
18
-
19
-
20
-
21
-
22
-
23
-
24
-
25
-
26
-
27
-
28
-
29
-
30
-
31
-
32
-
33
-
34
-
35
-
36
-
37
-
38
-
39
-
40
-
41
-
42
-
43
-
44
-
45
-
46
-
47
-
48
-
49
-
50
-
51
-
52
-
53
-
54
-
55
-
56
-
57
-
58
-
59
-
60
-
61
-
62
-
63
-
64
-
65
-
66
-
67
-
68
-
69
-
70
-
71
-
72
-
73
-
74
-
75
-
76
-
77
-
 78
78 -
 79
79 -
 80
80 -
 81
81 -
 82
82 -
 83
83 -
 84
84 -
 85
85 -
 86
86 -
 87
87 -
 88
88 -
 89
89 -
 90
90 -
 91
91 -
 92
92 -
 93
93 -
 94
94 -
 95
95 -
 96
96 -
 97
97 -
 98
98 -
99
-
100
-
101
-
102
-
103
-
104
-
105
-
106
-
107
-
108
-
109
-
110
-
111
-
112
-
113
-
114
-
115
-
116
-
117
-
118
-
119
-
120
-
121
-
122
-
123
-
124
-
125
-
126
-
127
-
128
-
129
-
130
-
131
-
132
-
133
-
134
-
135
-
136
-
137
-
138
-
139
-
140
-
141
-
142
-
143
-
144
-
145
-
146
-
147
-
148
-
149
-
150
-
151
-
152
-
153
-
154
-
155
-
156
-
157
-
158
-
159
-
160
-
161
-
162
-
163
-
164
-
165
-
166
-
167
-
168
-
169
-
170
-
171
-
172
-
173
-
174
-
175
-
176
-
177
-
178
-
179
-
180
-
181
-
182
-
183
-
184
-
185
-
186
-
187
-
188
-
189
-
190
-
191
-
192
-
193
-
194
-
195
-
196
-
197
-
198
-
199
-
200
-
201
-
202
-
203
-
204
-
205
-
206
-
207
-
208
-
209
-
210
-
211
-
212
-
213
-
214
-
215
-
216
-
217
-
218
-
219
-
220
-
221
-
222
-
223
-
224
-
225
-
226
-
227
-
228
-
229
-
230
-
231
-
232
-
233
-
234
-
235
-
236
-
237
-
238
-
239
-
240
-
241
-
242
-
243
-
244
-
245
-
246
-
247
-
248
-
249
-
250
-
251
-
252
-
253
-
254
-
255
-
256
-
257
-
258
-
259
-
260
-
261
-
262
-
263
-
264
-
265
-
266
-
267
-
268
-
269
-
270
-
271
-
272
-
273
-
274
-
275
-
276
-
277
-
278
-
279
-
280
-
281
-
282
-
283
-
284
-
285
-
286
-
287
-
288
-
289
-
290
-
291
-
292
-
293
-
294
-
295
-
296
-
297
-
298
-
299
-
300
-
301
-
302
 |
 |

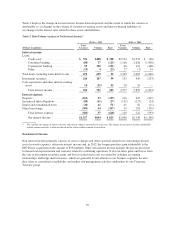
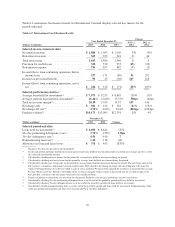
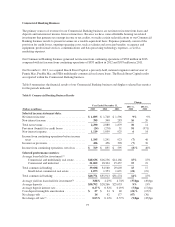
Table 6.1 summarizes the financial results for Domestic Card and displays selected key metrics for the periods
indicated.
Table 6.1: Domestic Card Business Results
(Dollars in millions)
Year Ended December 31,
Change
2013 vs.
2012
2012 vs.
20112013 2012 2011
Selected income statement data:
Net interest income ....................... $ 9,887 $ 9,129 $ 6,717 8% 36%
Non-interest income ...................... 2,957 2,725 2,368 915
Total net revenue ........................ 12,844 11,854 9,085 830
Provision for credit losses .................. 2,502 3,683 1,317 (32) 180
Non-interest expense ..................... 6,645 5,997 4,153 11 44
Income from continuing operations before
income taxes .......................... 3,697 2,174 3,615 70 (40)
Income tax provision ..................... 1,316 770 1,287 71 (40)
Income from continuing operations, net of
tax .................................. $ 2,381 $ 1,404 $ 2,328 70% (40)%
Selected performance metrics:
Average loans held for investment(1) . ........ $ 71,234 $ 71,754 $ 53,464 (1)% 34%
Average yield on loans held for investment(2) .. 15.27% 14.15% 14.14% 112bps 1bps
Total net revenue margin(3) ................. 18.03 16.52 16.99 151 (47)
Net charge-offs .......................... $ 2,904 $ 2,532 $ 2,522 15% —%
Net charge-off rate(4) ...................... 4.08% 3.53% 4.72% 55bps (119)bps
Card loan premium amortization and other
intangible accretion(5) ................... $ 198 $ 206 $ — (4)% **%
PCCR intangible amortization .............. 434 350 21 24 1,567
Purchase volume(6) ....................... 186,901 166,694 122,366 12 36
(Dollars in millions)
December 31,
2013 2012 Change
Selected period-end data:
Loans held for investment(1) ................ $ 73,255 $ 83,141 (12)%
30+ day delinquency rate(7) ................. 3.43% 3.61% (18)bps
Allowance for loan and lease losses .......... $ 2,836 $ 3,526 (20)%
** Change is less than one percent or not meaningful.
(1) Credit card period-end loans held for investment and average loans held for investment include accrued finance charges and fees, net of
the estimated uncollectible amount.
(2) Calculated by dividing interest income for the period by average loans held for investment during the period for the specified loan
category. Interest income includes interest income on loans held for sale. The transfer of Best Buy loan portfolio from loans held for
investment to loans held for sale resulted in an increase in the average yield for the Domestic Card business of 99 basis points in 2013.
(3) Calculated by dividing total net revenue for the period by average loans held for investment during the period. Interest income includes
interest income on loans held for sale. The transfer of Best Buy loan portfolio from loans held for investment to loans held for sale
resulted in an increase in the net revenue margin for the Domestic Card business of 111 basis points in 2013.
(4) Calculated by dividing net charge-offs for the period by average loans held for investment during the period.
(5) Represents the net reduction in interest income attributable to the amortization of premiums on purchased loans accounted for based on
contractual cash flows and the accretion of other intangibles associated with the 2012 U.S. card acquisition.
68