Capital One 2013 Annual Report Download - page 259
Download and view the complete annual report
Please find page 259 of the 2013 Capital One annual report below. You can navigate through the pages in the report by either clicking on the pages listed below, or by using the keyword search tool below to find specific information within the annual report.-
 1
1 -
2
-
3
-
4
-
5
-
6
-
7
-
8
-
9
-
10
-
11
-
12
-
13
-
14
-
15
-
16
-
17
-
18
-
19
-
20
-
21
-
22
-
23
-
24
-
25
-
26
-
27
-
28
-
29
-
30
-
31
-
32
-
33
-
34
-
35
-
36
-
37
-
38
-
39
-
40
-
41
-
42
-
43
-
44
-
45
-
46
-
47
-
48
-
49
-
50
-
51
-
52
-
53
-
54
-
55
-
56
-
57
-
58
-
59
-
60
-
61
-
62
-
63
-
64
-
65
-
66
-
67
-
68
-
69
-
70
-
71
-
72
-
73
-
74
-
75
-
76
-
77
-
78
-
79
-
80
-
81
-
82
-
83
-
84
-
85
-
86
-
87
-
88
-
89
-
90
-
91
-
92
-
93
-
94
-
95
-
96
-
97
-
98
-
99
-
100
-
101
-
102
-
103
-
104
-
105
-
106
-
107
-
108
-
109
-
110
-
111
-
112
-
113
-
114
-
115
-
116
-
117
-
118
-
119
-
120
-
121
-
122
-
123
-
124
-
125
-
126
-
127
-
128
-
129
-
130
-
131
-
132
-
133
-
134
-
135
-
136
-
137
-
138
-
139
-
140
-
141
-
142
-
143
-
144
-
145
-
146
-
147
-
148
-
149
-
150
-
151
-
152
-
153
-
154
-
155
-
156
-
157
-
158
-
159
-
160
-
161
-
162
-
163
-
164
-
165
-
166
-
167
-
168
-
169
-
170
-
171
-
172
-
173
-
174
-
175
-
176
-
177
-
178
-
179
-
180
-
181
-
182
-
183
-
184
-
185
-
186
-
187
-
188
-
189
-
190
-
191
-
192
-
193
-
194
-
195
-
196
-
197
-
198
-
199
-
200
-
201
-
202
-
203
-
204
-
205
-
206
-
207
-
208
-
209
-
210
-
211
-
212
-
213
-
214
-
215
-
216
-
217
-
218
-
219
-
220
-
221
-
222
-
223
-
224
-
225
-
226
-
227
-
228
-
229
-
230
-
231
-
232
-
233
-
234
-
235
-
236
-
237
-
238
-
239
-
240
-
241
-
242
-
243
-
244
-
245
-
246
-
247
-
248
-
 249
249 -
 250
250 -
 251
251 -
 252
252 -
 253
253 -
 254
254 -
 255
255 -
 256
256 -
 257
257 -
 258
258 -
 259
259 -
 260
260 -
 261
261 -
 262
262 -
 263
263 -
 264
264 -
 265
265 -
 266
266 -
 267
267 -
 268
268 -
 269
269 -
270
-
271
-
272
-
273
-
274
-
275
-
276
-
277
-
278
-
279
-
280
-
281
-
282
-
283
-
284
-
285
-
286
-
287
-
288
-
289
-
290
-
291
-
292
-
293
-
294
-
295
-
296
-
297
-
298
-
299
-
300
-
301
-
302
 |
 |

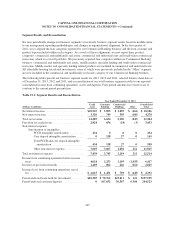
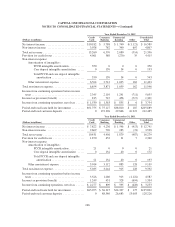
CAPITAL ONE FINANCIAL CORPORATION
NOTES TO CONSOLIDATED FINANCIAL STATEMENTS—(Continued)
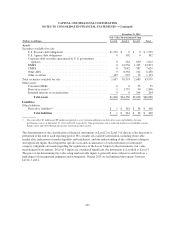
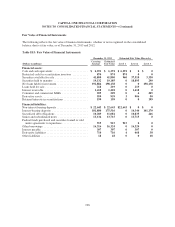
December 31, 2012 Estimated Fair Value Hierarchy
(Dollars in millions)
Carrying
Amount
Estimated
Fair Value Level 1 Level 2 Level 3
Financial assets:
Cash and cash equivalents ........................ $ 11,058 $ 11,058 $11,058 $ 0 $ 0
Restricted cash for securitization investors ........... 428 428 428 0 0
Securities available for sale ....................... 63,979 63,979 1,697 59,593 2,689
Securities held to maturity ........................ 9 9 0 9 0
Net loans held for investment ..................... 200,733 205,000 0 0 205,000
Loans held for sale .............................. 201 201 0 201 0
Interest receivable .............................. 1,694 1,694 0 1,694 0
Consumer and commercial MSRs .................. 55 550055
Derivatives assets ............................... 1,848 1,848 1 1,757 90
Retained interests in securitizations ................. 204 204 0 0 204
Financial liabilities:
Non-interest bearing deposits ...................... $ 22,467 $ 22,467 $22,467 $ 0 $ 0
Interest-bearing deposits ......................... 190,018 189,423 0 22,216 167,207
Securitized debt obligations ....................... 11,398 11,590 0 11,252 338
Senior and subordinated notes ..................... 12,686 13,312 0 13,312 0
Federal funds purchased and securities loaned or sold
under agreements to repurchase .................. 1,248 1,248 1,248 0 0
Other borrowings ............................... 24,578 24,616 346 24,215 55
Interest payable ................................ 450 450 0 450 0
Derivatives liabilities ............................ 400 400 1 361 38
Other liabilities ................................. 4 4 0 0 4
The following describes the valuation techniques used in estimating the fair value of our financial instruments as
of December 31, 2013 and 2012. We applied the fair value provisions to the financial instruments not recognized
on the consolidated balance sheets at fair value, which include securities held to maturity, loans held for
investment, interest receivable, non-interest bearing and interest bearing deposits, other borrowings, senior and
subordinated notes, and interest payable. The provisions requiring us to maximize the use of observable inputs
and to measure fair value using a notion of exit price were factored into our selection of inputs of our established
valuation techniques.
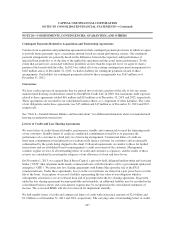
Financial Assets
Cash and Cash Equivalents
The carrying amounts of cash and due from banks, federal funds sold and securities purchased under agreements
to resell and interest-bearing deposits with banks approximate fair value.
Restricted Cash for Securitization Investors
The carrying amounts of restricted cash for securitization investors approximate their fair value due to their
relatively short-term nature.
Investment Securities
Quoted prices in active markets are used to measure the fair value of U.S. Treasury debt obligations. For other
investment categories, we utilize multiple third-party pricing services to obtain fair value measures for the large
239