Capital One 2013 Annual Report Download - page 65
Download and view the complete annual report
Please find page 65 of the 2013 Capital One annual report below. You can navigate through the pages in the report by either clicking on the pages listed below, or by using the keyword search tool below to find specific information within the annual report.-
 1
1 -
2
-
3
-
4
-
5
-
6
-
7
-
8
-
9
-
10
-
11
-
12
-
13
-
14
-
15
-
16
-
17
-
18
-
19
-
20
-
21
-
22
-
23
-
24
-
25
-
26
-
27
-
28
-
29
-
30
-
31
-
32
-
33
-
34
-
35
-
36
-
37
-
38
-
39
-
40
-
41
-
42
-
43
-
44
-
45
-
46
-
47
-
48
-
49
-
50
-
51
-
52
-
53
-
54
-
 55
55 -
 56
56 -
 57
57 -
 58
58 -
 59
59 -
 60
60 -
 61
61 -
 62
62 -
 63
63 -
 64
64 -
 65
65 -
 66
66 -
 67
67 -
 68
68 -
 69
69 -
 70
70 -
 71
71 -
 72
72 -
 73
73 -
 74
74 -
 75
75 -
76
-
77
-
78
-
79
-
80
-
81
-
82
-
83
-
84
-
85
-
86
-
87
-
88
-
89
-
90
-
91
-
92
-
93
-
94
-
95
-
96
-
97
-
98
-
99
-
100
-
101
-
102
-
103
-
104
-
105
-
106
-
107
-
108
-
109
-
110
-
111
-
112
-
113
-
114
-
115
-
116
-
117
-
118
-
119
-
120
-
121
-
122
-
123
-
124
-
125
-
126
-
127
-
128
-
129
-
130
-
131
-
132
-
133
-
134
-
135
-
136
-
137
-
138
-
139
-
140
-
141
-
142
-
143
-
144
-
145
-
146
-
147
-
148
-
149
-
150
-
151
-
152
-
153
-
154
-
155
-
156
-
157
-
158
-
159
-
160
-
161
-
162
-
163
-
164
-
165
-
166
-
167
-
168
-
169
-
170
-
171
-
172
-
173
-
174
-
175
-
176
-
177
-
178
-
179
-
180
-
181
-
182
-
183
-
184
-
185
-
186
-
187
-
188
-
189
-
190
-
191
-
192
-
193
-
194
-
195
-
196
-
197
-
198
-
199
-
200
-
201
-
202
-
203
-
204
-
205
-
206
-
207
-
208
-
209
-
210
-
211
-
212
-
213
-
214
-
215
-
216
-
217
-
218
-
219
-
220
-
221
-
222
-
223
-
224
-
225
-
226
-
227
-
228
-
229
-
230
-
231
-
232
-
233
-
234
-
235
-
236
-
237
-
238
-
239
-
240
-
241
-
242
-
243
-
244
-
245
-
246
-
247
-
248
-
249
-
250
-
251
-
252
-
253
-
254
-
255
-
256
-
257
-
258
-
259
-
260
-
261
-
262
-
263
-
264
-
265
-
266
-
267
-
268
-
269
-
270
-
271
-
272
-
273
-
274
-
275
-
276
-
277
-
278
-
279
-
280
-
281
-
282
-
283
-
284
-
285
-
286
-
287
-
288
-
289
-
290
-
291
-
292
-
293
-
294
-
295
-
296
-
297
-
298
-
299
-
300
-
301
-
302
 |
 |
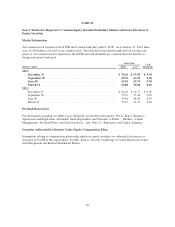
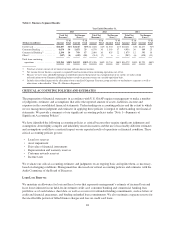
Below are additional highlights of our performance in 2013. These highlights generally are based on a
comparison between 2013 and 2012 results, except as otherwise noted. The changes in our financial condition
and credit performance are generally based on our financial condition and credit performance as of December 31,
2013, compared with our financial condition and credit performance as of December 31, 2012. We provide a
more detailed discussion of our financial performance in the sections following this “Executive Summary and
Business Outlook.”
Total Company
•Earnings: Our net income increased by $642 million in 2013, or 18%, to $4.2 billion, compared to
$3.5 billion for 2012. A significant driver of the increase in earnings in 2013 was the growth in interest
income attributable to (i) the increase in average interest-earning assets as a result of the ING Direct and
2012 U.S. card acquisitions, growth in purchase volumes in the Credit Card business and growth in auto
loans, partially offset by the Portfolio Sale and the expected run-off of home loans, and (ii) the decrease in
interest expense due to lower costs related to borrowings and debt obligations. Another factor contributing
to the increase in earnings was the absence in 2013 of the provision for credit losses of $1.2 billion related
to the credit card receivables acquired in the 2012 U.S. card acquisition recorded in the second quarter of
2012. This effect was partially offset by the absence in 2013 of the bargain purchase gain of $594 million
recorded in 2012 at the acquisition of ING Direct in the first quarter of 2012 and higher ongoing operating
expenses.
•Loans Held for Investment: Period-end loans held for investment decreased by $8.7 billion, or 4%, in 2013,
to $197.2 billion as of December 31, 2013, from $205.9 billion as of December 31, 2012. The decrease was
partially due to the Portfolio Sale. In addition to the Portfolio Sale, period-end loans held for investment
also decreased due to the expected run-off of certain credit card loans acquired in the 2012 U.S. card
acquisition, installment loans in our Credit Card business, home loans in our Consumer Banking business
and small-ticket commercial real estate loans in our Commercial Banking business. This run-off was
partially offset by continued strong auto loan originations in our Consumer Banking business and
commercial and industrial and commercial real estate loan growth in our Commercial Banking business.
•Charge-off and Delinquency Statistics: Our net charge-off rate increased by 15 basis points in 2013 to
2.04%, compared to 1.89% for 2012. The increases in our reported net charge-offs and net charge-off rate
were largely due to the run-off of certain credit card loans acquired in the 2012 U.S. card acquisition.
Acquired loans from this portfolio generally have no charge-offs, but the balance is included in the
denominator. As such, when these loans run-off and are replaced with originated loans, our charge-off rates
increase. Our reported 30+ day delinquency rate declined to 2.96% as of December 31, 2013, from 3.09% as
of December 31, 2012. We provide information on our credit quality metrics below under “Business
Segment Financial Performance” and “Credit Risk Profile.”
•Allowance for Loan and Lease Losses: We reduced our allowance by $841 million to $4.3 billion as of
December 31, 2013, from $5.2 billion as of December 31, 2012. The decrease in the allowance was mainly
due to an overall improved credit outlook coupled with improvements in delinquency inventories and the
reduction in loan balances. In addition, the allowance was reduced by $289 million related to the Portfolio
Sale in the third quarter of 2013. The allowance coverage ratio declined to 2.19% as of December 31, 2013,
from 2.50% as of December 31, 2012.
•Representation and Warranty Reserve: We recorded a mortgage representation and warranty provision of
$309 million in 2013 compared to $349 million in 2012. Our mortgage representation and warranty reserve
increased to $1.2 billion as of December 31, 2013, from $899 million as of December 31, 2012. The
increase in the reserve is primarily due to increased litigation and estimated settlement rates on active
litigation.
Business Segment Financial Performance
•Credit Card: Our Credit Card business generated net income from continuing operations of $2.6 billion in
2013, compared with net income from continuing operations of $1.5 billion in 2012. The increase in net
45