Capital One 2013 Annual Report Download - page 225
Download and view the complete annual report
Please find page 225 of the 2013 Capital One annual report below. You can navigate through the pages in the report by either clicking on the pages listed below, or by using the keyword search tool below to find specific information within the annual report.-
 1
1 -
2
-
3
-
4
-
5
-
6
-
7
-
8
-
9
-
10
-
11
-
12
-
13
-
14
-
15
-
16
-
17
-
18
-
19
-
20
-
21
-
22
-
23
-
24
-
25
-
26
-
27
-
28
-
29
-
30
-
31
-
32
-
33
-
34
-
35
-
36
-
37
-
38
-
39
-
40
-
41
-
42
-
43
-
44
-
45
-
46
-
47
-
48
-
49
-
50
-
51
-
52
-
53
-
54
-
55
-
56
-
57
-
58
-
59
-
60
-
61
-
62
-
63
-
64
-
65
-
66
-
67
-
68
-
69
-
70
-
71
-
72
-
73
-
74
-
75
-
76
-
77
-
78
-
79
-
80
-
81
-
82
-
83
-
84
-
85
-
86
-
87
-
88
-
89
-
90
-
91
-
92
-
93
-
94
-
95
-
96
-
97
-
98
-
99
-
100
-
101
-
102
-
103
-
104
-
105
-
106
-
107
-
108
-
109
-
110
-
111
-
112
-
113
-
114
-
115
-
116
-
117
-
118
-
119
-
120
-
121
-
122
-
123
-
124
-
125
-
126
-
127
-
128
-
129
-
130
-
131
-
132
-
133
-
134
-
135
-
136
-
137
-
138
-
139
-
140
-
141
-
142
-
143
-
144
-
145
-
146
-
147
-
148
-
149
-
150
-
151
-
152
-
153
-
154
-
155
-
156
-
157
-
158
-
159
-
160
-
161
-
162
-
163
-
164
-
165
-
166
-
167
-
168
-
169
-
170
-
171
-
172
-
173
-
174
-
175
-
176
-
177
-
178
-
179
-
180
-
181
-
182
-
183
-
184
-
185
-
186
-
187
-
188
-
189
-
190
-
191
-
192
-
193
-
194
-
195
-
196
-
197
-
198
-
199
-
200
-
201
-
202
-
203
-
204
-
205
-
206
-
207
-
208
-
209
-
210
-
211
-
212
-
213
-
214
-
 215
215 -
 216
216 -
 217
217 -
 218
218 -
 219
219 -
 220
220 -
 221
221 -
 222
222 -
 223
223 -
 224
224 -
 225
225 -
 226
226 -
 227
227 -
 228
228 -
 229
229 -
 230
230 -
 231
231 -
 232
232 -
 233
233 -
 234
234 -
 235
235 -
236
-
237
-
238
-
239
-
240
-
241
-
242
-
243
-
244
-
245
-
246
-
247
-
248
-
249
-
250
-
251
-
252
-
253
-
254
-
255
-
256
-
257
-
258
-
259
-
260
-
261
-
262
-
263
-
264
-
265
-
266
-
267
-
268
-
269
-
270
-
271
-
272
-
273
-
274
-
275
-
276
-
277
-
278
-
279
-
280
-
281
-
282
-
283
-
284
-
285
-
286
-
287
-
288
-
289
-
290
-
291
-
292
-
293
-
294
-
295
-
296
-
297
-
298
-
299
-
300
-
301
-
302
 |
 |

CAPITAL ONE FINANCIAL CORPORATION
NOTES TO CONSOLIDATED FINANCIAL STATEMENTS—(Continued)
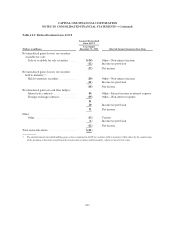
Balance Sheet Presentation
The following table summarizes the notional and fair value of our derivative instruments reported in our
consolidated balance sheets as of December 31, 2013 and 2012. The fair value amounts are segregated by
derivatives that are designated as accounting hedges those that are not, and are further segregated by type of
contract within those two categories.
Table 10.1: Derivative Assets and Liabilities at Fair Value
December 31, 2013 December 31, 2012
Notional or
Contractual
Amount
Derivatives at Fair Value Notional or
Contractual
Amount
Derivatives at Fair Value
(Dollars in millions) Assets Liabilities Assets Liabilities
Derivatives designated as accounting
hedges:
Interest rate contracts:
Fair value hedges ............... $15,695 $289 $223 $15,902 $1,020 $ 0
Cash flow hedges ............... 12,825 0 149 13,025 116 14
Total interest rate contracts ....... 28,520 289 372 28,927 1,136 14
Foreign exchange contracts:
Cash flow hedges ............... 4,806 49 53 5,212 18 40
Total derivatives designated as
accounting hedges ................ 33,326 338 425 34,139 1,154 54
Derivatives not designated as
accounting hedges:
Interest rate contracts covering:
MSRs ........................ 353 0 7 147 12 2
Customer accommodation ........ 25,365 405 209 18,900 479 273
Other interest rate exposures ...... 1,864 29 17 2,553 45 22
Total interest rate contracts ....... 27,582 434 233 21,600 536 297
Foreign exchange contracts ........... 1,422 184 37 1,372 158 46
Other contracts ..................... 1,094 3 15 701 0 3
Total derivatives not designated as
accounting hedges ................ 30,098 621 285 23,673 694 346
Total derivatives .................... $63,424 $959 $710 $57,812 $1,848 $400
Offsetting of Financial Assets and Liabilities
We execute the majority of our derivative transactions and repurchase agreements under master netting
arrangements. Under our existing enforceable master netting arrangements, we generally have the right to offset
exposure with the same counterparty. In addition, either counterparty can generally request the net settlement of
all contracts through a single payment upon default on, or termination of, any one contract.
We present all of our derivative assets and liabilities and repurchase agreements on a gross basis in our
consolidated balance sheets. The following table presents as of December 31, 2013 and 2012, the gross and net
fair values of our derivative assets and liabilities and repurchase agreements, as well as the related offsetting
amount permitted under the accounting standards for offsetting assets and liabilities. Under the accounting
standard, gross positive fair values could be offset against gross negative fair values by counterparty pursuant to
legally enforceable master netting, if the netting presentation method is elected. The table also includes cash and
non-cash collateral received or pledged associated with such arrangements.
205