Capital One 2013 Annual Report Download - page 133
Download and view the complete annual report
Please find page 133 of the 2013 Capital One annual report below. You can navigate through the pages in the report by either clicking on the pages listed below, or by using the keyword search tool below to find specific information within the annual report.-
 1
1 -
2
-
3
-
4
-
5
-
6
-
7
-
8
-
9
-
10
-
11
-
12
-
13
-
14
-
15
-
16
-
17
-
18
-
19
-
20
-
21
-
22
-
23
-
24
-
25
-
26
-
27
-
28
-
29
-
30
-
31
-
32
-
33
-
34
-
35
-
36
-
37
-
38
-
39
-
40
-
41
-
42
-
43
-
44
-
45
-
46
-
47
-
48
-
49
-
50
-
51
-
52
-
53
-
54
-
55
-
56
-
57
-
58
-
59
-
60
-
61
-
62
-
63
-
64
-
65
-
66
-
67
-
68
-
69
-
70
-
71
-
72
-
73
-
74
-
75
-
76
-
77
-
78
-
79
-
80
-
81
-
82
-
83
-
84
-
85
-
86
-
87
-
88
-
89
-
90
-
91
-
92
-
93
-
94
-
95
-
96
-
97
-
98
-
99
-
100
-
101
-
102
-
103
-
104
-
105
-
106
-
107
-
108
-
109
-
110
-
111
-
112
-
113
-
114
-
115
-
116
-
117
-
118
-
119
-
120
-
121
-
122
-
 123
123 -
 124
124 -
 125
125 -
 126
126 -
 127
127 -
 128
128 -
 129
129 -
 130
130 -
 131
131 -
 132
132 -
 133
133 -
 134
134 -
 135
135 -
 136
136 -
 137
137 -
 138
138 -
 139
139 -
 140
140 -
 141
141 -
 142
142 -
 143
143 -
144
-
145
-
146
-
147
-
148
-
149
-
150
-
151
-
152
-
153
-
154
-
155
-
156
-
157
-
158
-
159
-
160
-
161
-
162
-
163
-
164
-
165
-
166
-
167
-
168
-
169
-
170
-
171
-
172
-
173
-
174
-
175
-
176
-
177
-
178
-
179
-
180
-
181
-
182
-
183
-
184
-
185
-
186
-
187
-
188
-
189
-
190
-
191
-
192
-
193
-
194
-
195
-
196
-
197
-
198
-
199
-
200
-
201
-
202
-
203
-
204
-
205
-
206
-
207
-
208
-
209
-
210
-
211
-
212
-
213
-
214
-
215
-
216
-
217
-
218
-
219
-
220
-
221
-
222
-
223
-
224
-
225
-
226
-
227
-
228
-
229
-
230
-
231
-
232
-
233
-
234
-
235
-
236
-
237
-
238
-
239
-
240
-
241
-
242
-
243
-
244
-
245
-
246
-
247
-
248
-
249
-
250
-
251
-
252
-
253
-
254
-
255
-
256
-
257
-
258
-
259
-
260
-
261
-
262
-
263
-
264
-
265
-
266
-
267
-
268
-
269
-
270
-
271
-
272
-
273
-
274
-
275
-
276
-
277
-
278
-
279
-
280
-
281
-
282
-
283
-
284
-
285
-
286
-
287
-
288
-
289
-
290
-
291
-
292
-
293
-
294
-
295
-
296
-
297
-
298
-
299
-
300
-
301
-
302
 |
 |

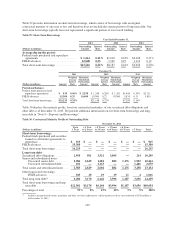
In the third quarter of 2013 we updated models and associated assumptions for our direct deposits, mortgage loan
and investment security prepayments which impacted our net interest income and economic value of equity
sensitivity metrics. Our new direct deposit model was developed on account level data and incorporates lagged
responses in both repricing and customer behavior as external market rates change. Additionally, we have
updated our mortgage prepayment model. The modeling changes had a small impact on our economic value of
equity sensitivity measure, but resulted in a larger impact to our next 12-month net interest income sensitivity,
driven primarily from the deposit model change. We have included the table below that shows net interest
income and economic value of equity sensitivity as of December 31, 2013 and December 31, 2012.
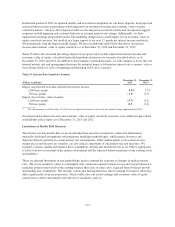
Table 33 shows the estimated percentage impact on our projected base-line adjusted net interest income and
economic value of equity, calculated under the hypothetical interest rate scenarios described above, as of
December 31, 2013 and 2012. In addition to these industry standard measures, we will continue to factor into our
internal interest rate risk management decisions the potential impact of alternative interest rate scenarios, such as
stressed rate shocks as well as steepening and flattening yield curve scenarios.
Table 33: Interest Rate Sensitivity Analysis
(Dollars in millions)
December 31,
2013
December 31,
2012(1)
Impact on projected base-line adjusted net interest income:
+200 basis points .................................................. 4.9% 2.7%
-50 basis points ................................................... (1.5) (1.7)
Impact on economic value of equity:
+200 basis points .................................................. (5.7) (3.1)
-50 basis points ................................................... 0.3 (1.4)
(1) The measurement as of December 31, 2012 was not adjusted retrospectively for the new model change implemented in 2013.
Our projected net interest income and economic value of equity sensitivity measures were within our prescribed
asset/liability policy limits as of December 31, 2013 and 2012.
Limitations of Market Risk Measures
The interest rate risk models that we use in deriving these measures incorporate contractual information,
internally-developed assumptions and proprietary modeling methodologies, which project borrower and
depositor behavior patterns in certain interest rate environments. Other market inputs, such as interest rates,
market prices and interest rate volatility, are also critical components of our interest rate risk measures. We
regularly evaluate, update and enhance these assumptions, models and analytical tools as we believe appropriate
to reflect our best assessment of the market environment and the expected behavior patterns of our existing assets
and liabilities.
There are inherent limitations in any methodology used to estimate the exposure to changes in market interest
rates. The above sensitivity analysis contemplate only certain movements in interest rates and are performed at a
particular point in time based on the existing balance sheet and, in some cases, expected future business growth
and funding mix assumptions. The strategic actions that management may take to manage our balance sheet may
differ significantly from our projections, which could cause our actual earnings and economic value of equity
sensitivities to differ substantially from the above sensitivity analysis.
113