Capital One 2013 Annual Report Download - page 70
Download and view the complete annual report
Please find page 70 of the 2013 Capital One annual report below. You can navigate through the pages in the report by either clicking on the pages listed below, or by using the keyword search tool below to find specific information within the annual report.-
 1
1 -
2
-
3
-
4
-
5
-
6
-
7
-
8
-
9
-
10
-
11
-
12
-
13
-
14
-
15
-
16
-
17
-
18
-
19
-
20
-
21
-
22
-
23
-
24
-
25
-
26
-
27
-
28
-
29
-
30
-
31
-
32
-
33
-
34
-
35
-
36
-
37
-
38
-
39
-
40
-
41
-
42
-
43
-
44
-
45
-
46
-
47
-
48
-
49
-
50
-
51
-
52
-
53
-
54
-
55
-
56
-
57
-
58
-
59
-
 60
60 -
 61
61 -
 62
62 -
 63
63 -
 64
64 -
 65
65 -
 66
66 -
 67
67 -
 68
68 -
 69
69 -
 70
70 -
 71
71 -
 72
72 -
 73
73 -
 74
74 -
 75
75 -
 76
76 -
 77
77 -
 78
78 -
 79
79 -
 80
80 -
81
-
82
-
83
-
84
-
85
-
86
-
87
-
88
-
89
-
90
-
91
-
92
-
93
-
94
-
95
-
96
-
97
-
98
-
99
-
100
-
101
-
102
-
103
-
104
-
105
-
106
-
107
-
108
-
109
-
110
-
111
-
112
-
113
-
114
-
115
-
116
-
117
-
118
-
119
-
120
-
121
-
122
-
123
-
124
-
125
-
126
-
127
-
128
-
129
-
130
-
131
-
132
-
133
-
134
-
135
-
136
-
137
-
138
-
139
-
140
-
141
-
142
-
143
-
144
-
145
-
146
-
147
-
148
-
149
-
150
-
151
-
152
-
153
-
154
-
155
-
156
-
157
-
158
-
159
-
160
-
161
-
162
-
163
-
164
-
165
-
166
-
167
-
168
-
169
-
170
-
171
-
172
-
173
-
174
-
175
-
176
-
177
-
178
-
179
-
180
-
181
-
182
-
183
-
184
-
185
-
186
-
187
-
188
-
189
-
190
-
191
-
192
-
193
-
194
-
195
-
196
-
197
-
198
-
199
-
200
-
201
-
202
-
203
-
204
-
205
-
206
-
207
-
208
-
209
-
210
-
211
-
212
-
213
-
214
-
215
-
216
-
217
-
218
-
219
-
220
-
221
-
222
-
223
-
224
-
225
-
226
-
227
-
228
-
229
-
230
-
231
-
232
-
233
-
234
-
235
-
236
-
237
-
238
-
239
-
240
-
241
-
242
-
243
-
244
-
245
-
246
-
247
-
248
-
249
-
250
-
251
-
252
-
253
-
254
-
255
-
256
-
257
-
258
-
259
-
260
-
261
-
262
-
263
-
264
-
265
-
266
-
267
-
268
-
269
-
270
-
271
-
272
-
273
-
274
-
275
-
276
-
277
-
278
-
279
-
280
-
281
-
282
-
283
-
284
-
285
-
286
-
287
-
288
-
289
-
290
-
291
-
292
-
293
-
294
-
295
-
296
-
297
-
298
-
299
-
300
-
301
-
302
 |
 |
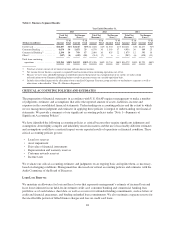
billed finance charges and fees, we reduce the balance of our credit card loan receivables by the amount of
finance charges and fees billed but not expected to be collected and exclude this amount from revenue. Total net
revenue was reduced by $796 million, $937 million and $371 million in 2013, 2012 and 2011, respectively, for
the estimated uncollectible amount of billed finance charges and fees. The finance charge and fee reserve totaled
$190 million as of December 31, 2013, compared with $307 million as of December 31, 2012.
We review and assess the adequacy of the uncollectible finance charge and fee reserve on a quarterly basis. Our
methodology for estimating the uncollectible portion of billed finance charges and fees is consistent with the
methodology we use to estimate the allowance for incurred principal losses on our credit card loan receivables.
Asset Impairment
In addition to our loan portfolio, we review other assets for impairment on a regular basis in accordance with
applicable impairment accounting guidance. This process requires significant management judgment and
involves various estimates and assumptions. Our investment securities and goodwill and intangible assets
represent a significant portion of our other assets. Accordingly, below we describe our process for assessing
impairment of these assets and the key estimates and assumptions involved in this process.
Investment Securities
We regularly review investment securities for other-than-temporary impairment (“OTTI”) using both quantitative
and qualitative criteria. If we intend to sell a security in an unrealized loss position or it is more likely than not
that we will be required to sell the security prior to recovery of its amortized cost basis, the entire difference
between the amortized cost basis of the security and its fair value is recognized in earnings. If we do not intend to
sell the security and it is not more likely than not that we will be required to sell the security before recovery of
our amortized cost, we evaluate other qualitative criteria to determine whether a credit loss exists. Our evaluation
requires significant management judgment and a consideration of many factors, including, but not limited to, the
extent and duration of the impairment; the health of and specific prospects for the issuer, including whether the
issuer has failed to make scheduled interest or principal payments; recent events specific to the issuer and/or
industry to which the issuer belongs; the payment structure of the security; external credit ratings; the value of
underlying collateral and current market conditions. Quantitative criteria include assessing whether there has
been an adverse change in expected future cash flows. See “Note 3—Investment Securities” for additional
information.
Goodwill and Other Intangible Assets
Goodwill resulting from business combinations prior to January 1, 2009 represents the excess of the purchase
price over the fair value of the net assets of businesses acquired. Goodwill resulting from business combinations
after January 1, 2009, is generally determined as the excess of the fair value of the consideration transferred, plus
the fair value of any non-controlling interests in the acquiree, over the fair value of the net assets acquired and
liabilities assumed as of the acquisition date.
Goodwill totaled $14.0 billion and $13.9 billion as of December 31, 2013 and 2012, respectively. Other
intangible assets, which we report on our consolidated balance sheets as a component of other assets, consist
primarily of purchased credit card relationships (“PCCR”) and core deposit intangibles. The net carrying value of
other intangible assets decreased to $1.8 billion as of December 31, 2013, from $2.6 billion as of December 31,
2012. Goodwill and other intangible assets together represented 5% of our total assets as of both December 31,
2013 and 2012, respectively. We did not recognize goodwill impairment in 2013, 2012 or 2011.
50