Capital One 2013 Annual Report Download - page 80
Download and view the complete annual report
Please find page 80 of the 2013 Capital One annual report below. You can navigate through the pages in the report by either clicking on the pages listed below, or by using the keyword search tool below to find specific information within the annual report.-
 1
1 -
2
-
3
-
4
-
5
-
6
-
7
-
8
-
9
-
10
-
11
-
12
-
13
-
14
-
15
-
16
-
17
-
18
-
19
-
20
-
21
-
22
-
23
-
24
-
25
-
26
-
27
-
28
-
29
-
30
-
31
-
32
-
33
-
34
-
35
-
36
-
37
-
38
-
39
-
40
-
41
-
42
-
43
-
44
-
45
-
46
-
47
-
48
-
49
-
50
-
51
-
52
-
53
-
54
-
55
-
56
-
57
-
58
-
59
-
60
-
61
-
62
-
63
-
64
-
65
-
66
-
67
-
68
-
69
-
 70
70 -
 71
71 -
 72
72 -
 73
73 -
 74
74 -
 75
75 -
 76
76 -
 77
77 -
 78
78 -
 79
79 -
 80
80 -
 81
81 -
 82
82 -
 83
83 -
 84
84 -
 85
85 -
 86
86 -
 87
87 -
 88
88 -
 89
89 -
 90
90 -
91
-
92
-
93
-
94
-
95
-
96
-
97
-
98
-
99
-
100
-
101
-
102
-
103
-
104
-
105
-
106
-
107
-
108
-
109
-
110
-
111
-
112
-
113
-
114
-
115
-
116
-
117
-
118
-
119
-
120
-
121
-
122
-
123
-
124
-
125
-
126
-
127
-
128
-
129
-
130
-
131
-
132
-
133
-
134
-
135
-
136
-
137
-
138
-
139
-
140
-
141
-
142
-
143
-
144
-
145
-
146
-
147
-
148
-
149
-
150
-
151
-
152
-
153
-
154
-
155
-
156
-
157
-
158
-
159
-
160
-
161
-
162
-
163
-
164
-
165
-
166
-
167
-
168
-
169
-
170
-
171
-
172
-
173
-
174
-
175
-
176
-
177
-
178
-
179
-
180
-
181
-
182
-
183
-
184
-
185
-
186
-
187
-
188
-
189
-
190
-
191
-
192
-
193
-
194
-
195
-
196
-
197
-
198
-
199
-
200
-
201
-
202
-
203
-
204
-
205
-
206
-
207
-
208
-
209
-
210
-
211
-
212
-
213
-
214
-
215
-
216
-
217
-
218
-
219
-
220
-
221
-
222
-
223
-
224
-
225
-
226
-
227
-
228
-
229
-
230
-
231
-
232
-
233
-
234
-
235
-
236
-
237
-
238
-
239
-
240
-
241
-
242
-
243
-
244
-
245
-
246
-
247
-
248
-
249
-
250
-
251
-
252
-
253
-
254
-
255
-
256
-
257
-
258
-
259
-
260
-
261
-
262
-
263
-
264
-
265
-
266
-
267
-
268
-
269
-
270
-
271
-
272
-
273
-
274
-
275
-
276
-
277
-
278
-
279
-
280
-
281
-
282
-
283
-
284
-
285
-
286
-
287
-
288
-
289
-
290
-
291
-
292
-
293
-
294
-
295
-
296
-
297
-
298
-
299
-
300
-
301
-
302
 |
 |

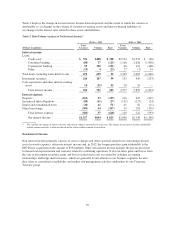
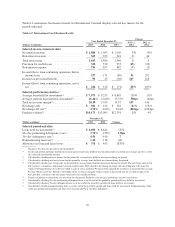
Table 4 displays the components of non-interest income for 2013, 2012 and 2011.
Table 4: Non-Interest Income
Year Ended December 31,
(Dollars in millions) 2013 2012 2011
Service charges and other customer-related fees ........................... $2,118 $2,106 $1,979
Interchange fees, net ................................................. 1,896 1,647 1,318
Bargain purchase gain(1) .............................................. —594 —
Net other-than-temporary impairment ................................... (41) (52) (21)
Other non-interest income:
(Provision) benefit for mortgage representation and warranty(2) ........... 24 (42) (43)
Net gains from the sale of investment securities ....................... 745 259
Net fair value gains (losses) on free-standing derivatives(3)(4) ............. 3(36) (197)
Other(5) ....................................................... 271 545 243
Other non-interest income ............................................ 305 512 262
Total non-interest income ............................................. $4,278 $4,807 $3,538
(1) Represents the amount by which the fair value of the net assets acquired in the ING Direct acquisition, as of the acquisition date
exceeded the consideration transferred.
(2) Represents mortgage representation and warranty provision related to continuing operations. We recorded a total provision for
mortgage representation and warranty losses of $309 million, $349 million and $212 million for 2013, 2012 and 2011, respectively. The
remaining portion of the provision for mortgage representation and warranty losses is included, net of tax, in discontinued operations.
(3) Excludes changes in cumulative credit risk valuation adjustments related to derivatives in a gain position. Credit risk valuation
adjustments for derivative assets totaled $7 million, $9 million and $23 million as of December 31, 2013, 2012 and 2011, respectively.
See “Note 10—Derivative Instruments and Hedging Activities” for additional information.
(4) Includes mark-to-market derivative losses of $78 million and $277 million in 2012 and 2011, respectively, related to interest-rate swaps
we entered into in 2011 to partially hedge the interest rate risk of the net assets associated with the ING Direct acquisition.
(5) Other includes derivative hedge ineffectiveness losses of $43 million and $36 million in 2013 and 2012, respectively, and gains of $15
million in 2011. Other also includes income of $162 million in 2012 related to the sale of Visa stock shares.
Non-interest income of $4.3 billion in 2013 decreased by $529 million, or 11%, from non-interest income of
$4.8 billion in 2012. The decrease in non-interest income reflected the combined impact of the absence of the
bargain purchase gain of $594 million recognized at acquisition of ING Direct and income of $162 million from
the sale of Visa stock shares, both of which were recorded in 2012. The impact of these items was partially offset
by the favorable impact of increased customer related fees and interchange fees from purchase volume growth,
due in part to the acquisitions, fee based products and services revenue, a reduction in the provision for mortgage
representation and warranty losses and a reduction in fair value losses on free standing derivatives.
Non-interest income of $4.8 billion in 2012 increased by $1.3 billion, or 36%, from non-interest income of
$3.5 billion in 2011. This increase reflected the combined impact of: (i) the bargain purchase gain of $594 million
recorded at acquisition of ING Direct; (ii) increased net interchange and other fees resulting from continued growth
and market share from new account originations, due in part to the ING Direct and the 2012 U.S. card acquisitions;
(iii) income of $162 million from the sale of Visa stock shares in the first quarter of 2012; and (iv) mark-to-market
gains of $85 million recognized on retained interests in mortgage-related securities. The favorable impact of these
items was partially offset by expected customer refunds of approximately $115 million related to cross-sell
activities in our Domestic Card business, approximately $214 million lower net gains from the sale of available for
sale securities recorded in 2012 versus 2011, and a mark-to-market derivative loss of $78 million recognized in the
first quarter of 2012 related to the settlement of interest-rate swaps we entered into in 2011 to partially hedge the
interest rate risk of the net assets associated with the ING Direct acquisition.
60