Capital One 2013 Annual Report Download - page 64
Download and view the complete annual report
Please find page 64 of the 2013 Capital One annual report below. You can navigate through the pages in the report by either clicking on the pages listed below, or by using the keyword search tool below to find specific information within the annual report.-
 1
1 -
2
-
3
-
4
-
5
-
6
-
7
-
8
-
9
-
10
-
11
-
12
-
13
-
14
-
15
-
16
-
17
-
18
-
19
-
20
-
21
-
22
-
23
-
24
-
25
-
26
-
27
-
28
-
29
-
30
-
31
-
32
-
33
-
34
-
35
-
36
-
37
-
38
-
39
-
40
-
41
-
42
-
43
-
44
-
45
-
46
-
47
-
48
-
49
-
50
-
51
-
52
-
53
-
 54
54 -
 55
55 -
 56
56 -
 57
57 -
 58
58 -
 59
59 -
 60
60 -
 61
61 -
 62
62 -
 63
63 -
 64
64 -
 65
65 -
 66
66 -
 67
67 -
 68
68 -
 69
69 -
 70
70 -
 71
71 -
 72
72 -
 73
73 -
 74
74 -
75
-
76
-
77
-
78
-
79
-
80
-
81
-
82
-
83
-
84
-
85
-
86
-
87
-
88
-
89
-
90
-
91
-
92
-
93
-
94
-
95
-
96
-
97
-
98
-
99
-
100
-
101
-
102
-
103
-
104
-
105
-
106
-
107
-
108
-
109
-
110
-
111
-
112
-
113
-
114
-
115
-
116
-
117
-
118
-
119
-
120
-
121
-
122
-
123
-
124
-
125
-
126
-
127
-
128
-
129
-
130
-
131
-
132
-
133
-
134
-
135
-
136
-
137
-
138
-
139
-
140
-
141
-
142
-
143
-
144
-
145
-
146
-
147
-
148
-
149
-
150
-
151
-
152
-
153
-
154
-
155
-
156
-
157
-
158
-
159
-
160
-
161
-
162
-
163
-
164
-
165
-
166
-
167
-
168
-
169
-
170
-
171
-
172
-
173
-
174
-
175
-
176
-
177
-
178
-
179
-
180
-
181
-
182
-
183
-
184
-
185
-
186
-
187
-
188
-
189
-
190
-
191
-
192
-
193
-
194
-
195
-
196
-
197
-
198
-
199
-
200
-
201
-
202
-
203
-
204
-
205
-
206
-
207
-
208
-
209
-
210
-
211
-
212
-
213
-
214
-
215
-
216
-
217
-
218
-
219
-
220
-
221
-
222
-
223
-
224
-
225
-
226
-
227
-
228
-
229
-
230
-
231
-
232
-
233
-
234
-
235
-
236
-
237
-
238
-
239
-
240
-
241
-
242
-
243
-
244
-
245
-
246
-
247
-
248
-
249
-
250
-
251
-
252
-
253
-
254
-
255
-
256
-
257
-
258
-
259
-
260
-
261
-
262
-
263
-
264
-
265
-
266
-
267
-
268
-
269
-
270
-
271
-
272
-
273
-
274
-
275
-
276
-
277
-
278
-
279
-
280
-
281
-
282
-
283
-
284
-
285
-
286
-
287
-
288
-
289
-
290
-
291
-
292
-
293
-
294
-
295
-
296
-
297
-
298
-
299
-
300
-
301
-
302
 |
 |

Item 7. Management’s Discussion and Analysis of Financial Condition and Results of Operations (“MD&A”)
This discussion contains forward-looking statements that are based upon management’s current expectations
and are subject to significant uncertainties and changes in circumstances. Please review “Forward-Looking
Statements” for more information on the forward-looking statements in this Report. Our actual results may differ
materially from those included in these forward-looking statements due to a variety of factors including, but not
limited to, those described in this Report in “Part I—Item 1A. Risk Factors.” Unless otherwise specified,
references to notes to our consolidated financial statements refers to the notes to our consolidated financial
statements as of December 31, 2013 included in this 2013 Annual Report.
Management monitors a variety of key indicators to evaluate our business results and financial condition. The
following MD&A is intended to provide the reader with an understanding of our results of operations, financial
condition and liquidity by focusing on changes from year to year in certain key measures used by management to
evaluate performance, such as profitability, growth and credit quality metrics. MD&A is provided as a
supplement to, and should be read in conjunction with, our audited consolidated financial statements as of
December 31, 2013 and accompanying notes. MD&A is organized in the following sections:
• Executive Summary and Business Outlook
• Critical Accounting Policies and Estimates
• Accounting Changes and Developments
• Consolidated Results of Operations
• Business Segment Financial Performance
• Consolidated Balance Sheets Analysis
• Off-Balance Sheet Arrangements and Variable
Interest Entities
• Capital Management
• Risk Management
• Credit Risk Profile
• Liquidity Risk Profile
• Market Risk Profile
• Supplemental Tables
• Glossary and Acronyms
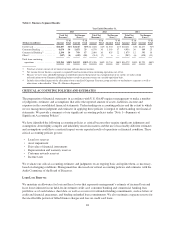
EXECUTIVE SUMMARY AND BUSINESS OUTLOOK
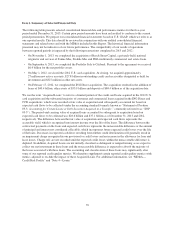
In 2013, we continued to deliver strong returns. All three of our business segments delivered growth in total
revenues during the year, allowing us to remain focused on providing sustained and improved profitability and
shareholder value.
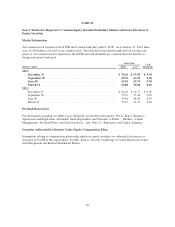
On July 2, 2013, our Board of Directors authorized the repurchase of up to $1 billion of shares of our common
stock (“2013 Stock Repurchase Program”) upon the closing of the Portfolio Sale. As of December 31, 2013, we
have completed the repurchase of common stock as part of the 2013 Stock Repurchase Program.
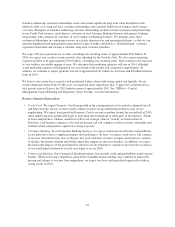
Financial Highlights
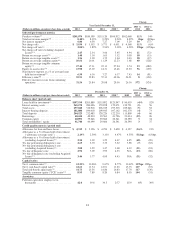
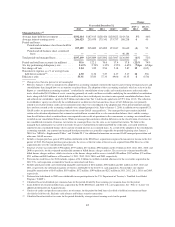
We reported net income of $4.2 billion ($6.96 per diluted share) on total net revenue of $22.4 billion for 2013,
with each of our three business segments contributing to our earnings. In comparison, we reported net income of
$3.5 billion ($6.16 per diluted share) on total net revenue of $21.4 billion for 2012 and $3.1 billion ($6.80 per
diluted share) on total net revenue of $16.3 billion in 2011.
Our Tier 1 common ratio, as calculated under Basel I, increased to 12.23% as of December 31, 2013, up
127 basis points from 10.96% as of December 31, 2012. The increase in our Tier 1 common ratio reflects strong
internal capital generation from earnings and the full benefit of the decline in risk weighted assets from the
Portfolio Sale, which was offset by the decline in capital level from the 2013 Stock Repurchase Program. See
“Capital Management” below for additional information.
44