Capital One 2013 Annual Report Download - page 226
Download and view the complete annual report
Please find page 226 of the 2013 Capital One annual report below. You can navigate through the pages in the report by either clicking on the pages listed below, or by using the keyword search tool below to find specific information within the annual report.-
 1
1 -
2
-
3
-
4
-
5
-
6
-
7
-
8
-
9
-
10
-
11
-
12
-
13
-
14
-
15
-
16
-
17
-
18
-
19
-
20
-
21
-
22
-
23
-
24
-
25
-
26
-
27
-
28
-
29
-
30
-
31
-
32
-
33
-
34
-
35
-
36
-
37
-
38
-
39
-
40
-
41
-
42
-
43
-
44
-
45
-
46
-
47
-
48
-
49
-
50
-
51
-
52
-
53
-
54
-
55
-
56
-
57
-
58
-
59
-
60
-
61
-
62
-
63
-
64
-
65
-
66
-
67
-
68
-
69
-
70
-
71
-
72
-
73
-
74
-
75
-
76
-
77
-
78
-
79
-
80
-
81
-
82
-
83
-
84
-
85
-
86
-
87
-
88
-
89
-
90
-
91
-
92
-
93
-
94
-
95
-
96
-
97
-
98
-
99
-
100
-
101
-
102
-
103
-
104
-
105
-
106
-
107
-
108
-
109
-
110
-
111
-
112
-
113
-
114
-
115
-
116
-
117
-
118
-
119
-
120
-
121
-
122
-
123
-
124
-
125
-
126
-
127
-
128
-
129
-
130
-
131
-
132
-
133
-
134
-
135
-
136
-
137
-
138
-
139
-
140
-
141
-
142
-
143
-
144
-
145
-
146
-
147
-
148
-
149
-
150
-
151
-
152
-
153
-
154
-
155
-
156
-
157
-
158
-
159
-
160
-
161
-
162
-
163
-
164
-
165
-
166
-
167
-
168
-
169
-
170
-
171
-
172
-
173
-
174
-
175
-
176
-
177
-
178
-
179
-
180
-
181
-
182
-
183
-
184
-
185
-
186
-
187
-
188
-
189
-
190
-
191
-
192
-
193
-
194
-
195
-
196
-
197
-
198
-
199
-
200
-
201
-
202
-
203
-
204
-
205
-
206
-
207
-
208
-
209
-
210
-
211
-
212
-
213
-
214
-
215
-
 216
216 -
 217
217 -
 218
218 -
 219
219 -
 220
220 -
 221
221 -
 222
222 -
 223
223 -
 224
224 -
 225
225 -
 226
226 -
 227
227 -
 228
228 -
 229
229 -
 230
230 -
 231
231 -
 232
232 -
 233
233 -
 234
234 -
 235
235 -
 236
236 -
237
-
238
-
239
-
240
-
241
-
242
-
243
-
244
-
245
-
246
-
247
-
248
-
249
-
250
-
251
-
252
-
253
-
254
-
255
-
256
-
257
-
258
-
259
-
260
-
261
-
262
-
263
-
264
-
265
-
266
-
267
-
268
-
269
-
270
-
271
-
272
-
273
-
274
-
275
-
276
-
277
-
278
-
279
-
280
-
281
-
282
-
283
-
284
-
285
-
286
-
287
-
288
-
289
-
290
-
291
-
292
-
293
-
294
-
295
-
296
-
297
-
298
-
299
-
300
-
301
-
302
 |
 |

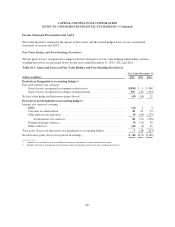
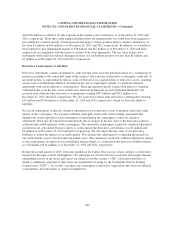
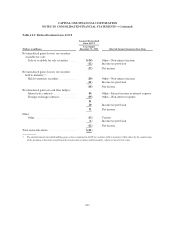
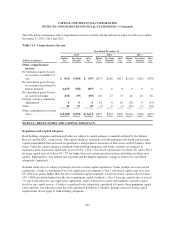
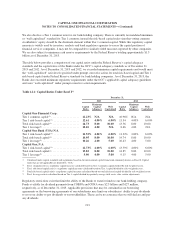
CAPITAL ONE FINANCIAL CORPORATION
NOTES TO CONSOLIDATED FINANCIAL STATEMENTS—(Continued)
Table 10.2: Offsetting of Financial Assets and Financial Liabilities
(Dollars in millions)
Gross
Amounts of
Recognized
Assets
Gross
Amounts
Offset in the
Consolidated
Balance
Sheet
Net Amounts
of Assets
Presented
in the
Consolidated
Balance Sheet
Gross Amounts Not
Offset in the Consolidated
Balance Sheet
Financial
Instruments
Collateral
Received
Net
Exposure
As of December 31, 2013
Derivatives ..................... $ 959 $0 $ 959 $(262) $ (450)(1) $247(2)
Total .......................... $ 959 $0 $ 959 $(262) $ (450) $247
(Dollars in millions)
Gross
Amounts of
Recognized
Liabilities
Gross
Amounts
Offset in the
Consolidated
Balance
Sheet
Net Amounts
of Liabilities
Presented
in the
Consolidated
Balance Sheet
Gross Amounts Not
Offset in the Consolidated
Balance Sheet
Financial
Instruments
Collateral
Pledged
Net
Exposure
As of December 31, 2013
Derivatives ..................... $ 710 $0 $ 710 $(262) $ (371)(1) $ 77
Repurchase agreements ........... 907 0 907 0 (907) 0
Total .......................... $1,617 $0 $1,617 $(262) $(1,278) $ 77
(Dollars in millions)
Gross
Amounts of
Recognized
Assets
Gross
Amounts
Offset in the
Consolidated
Balance
Sheet
Net Amounts
of Assets
Presented
in the
Consolidated
Balance Sheet
Gross Amounts Not
Offset in the Consolidated
Balance Sheet
Financial
Instruments
Collateral
Received
Net
Exposure
As of December 31, 2012
Derivatives ..................... $1,848 $0 $1,848 $(220) $(1,160)(1) $468(2)
Total .......................... $1,848 $0 $1,848 $(220) $(1,160) $468
(Dollars in millions)
Gross
Amounts of
Recognized
Liabilities
Gross
Amounts
Offset in the
Consolidated
Balance
Sheet
Net Amounts
of Liabilities
Presented
in the
Consolidated
Balance Sheet
Gross Amounts Not
Offset in the Consolidated
Balance Sheet
Financial
Instruments
Collateral
Pledged
Net
Exposure
As of December 31, 2012
Derivatives ..................... $ 400 $0 $ 400 $(220) $ (98)(1) $ 82
Repurchase agreements ........... 1,235 0 1,235 0 (1,235) 0
Total .......................... $1,635 $0 $1,635 $(220) $(1,333) $ 82
(1) When we receive or pledge collateral, we factor in accrued interest when calculating net positions with counterparties.
(2) The majority of the net position relates to customer-accommodation derivatives. Customer-accommodation derivatives are cross-
collateralized by the associated commercial loans and we do not require additional collateral on these transactions.
206