Capital One 2013 Annual Report Download - page 62
Download and view the complete annual report
Please find page 62 of the 2013 Capital One annual report below. You can navigate through the pages in the report by either clicking on the pages listed below, or by using the keyword search tool below to find specific information within the annual report.-
 1
1 -
2
-
3
-
4
-
5
-
6
-
7
-
8
-
9
-
10
-
11
-
12
-
13
-
14
-
15
-
16
-
17
-
18
-
19
-
20
-
21
-
22
-
23
-
24
-
25
-
26
-
27
-
28
-
29
-
30
-
31
-
32
-
33
-
34
-
35
-
36
-
37
-
38
-
39
-
40
-
41
-
42
-
43
-
44
-
45
-
46
-
47
-
48
-
49
-
50
-
51
-
 52
52 -
 53
53 -
 54
54 -
 55
55 -
 56
56 -
 57
57 -
 58
58 -
 59
59 -
 60
60 -
 61
61 -
 62
62 -
 63
63 -
 64
64 -
 65
65 -
 66
66 -
 67
67 -
 68
68 -
 69
69 -
 70
70 -
 71
71 -
 72
72 -
73
-
74
-
75
-
76
-
77
-
78
-
79
-
80
-
81
-
82
-
83
-
84
-
85
-
86
-
87
-
88
-
89
-
90
-
91
-
92
-
93
-
94
-
95
-
96
-
97
-
98
-
99
-
100
-
101
-
102
-
103
-
104
-
105
-
106
-
107
-
108
-
109
-
110
-
111
-
112
-
113
-
114
-
115
-
116
-
117
-
118
-
119
-
120
-
121
-
122
-
123
-
124
-
125
-
126
-
127
-
128
-
129
-
130
-
131
-
132
-
133
-
134
-
135
-
136
-
137
-
138
-
139
-
140
-
141
-
142
-
143
-
144
-
145
-
146
-
147
-
148
-
149
-
150
-
151
-
152
-
153
-
154
-
155
-
156
-
157
-
158
-
159
-
160
-
161
-
162
-
163
-
164
-
165
-
166
-
167
-
168
-
169
-
170
-
171
-
172
-
173
-
174
-
175
-
176
-
177
-
178
-
179
-
180
-
181
-
182
-
183
-
184
-
185
-
186
-
187
-
188
-
189
-
190
-
191
-
192
-
193
-
194
-
195
-
196
-
197
-
198
-
199
-
200
-
201
-
202
-
203
-
204
-
205
-
206
-
207
-
208
-
209
-
210
-
211
-
212
-
213
-
214
-
215
-
216
-
217
-
218
-
219
-
220
-
221
-
222
-
223
-
224
-
225
-
226
-
227
-
228
-
229
-
230
-
231
-
232
-
233
-
234
-
235
-
236
-
237
-
238
-
239
-
240
-
241
-
242
-
243
-
244
-
245
-
246
-
247
-
248
-
249
-
250
-
251
-
252
-
253
-
254
-
255
-
256
-
257
-
258
-
259
-
260
-
261
-
262
-
263
-
264
-
265
-
266
-
267
-
268
-
269
-
270
-
271
-
272
-
273
-
274
-
275
-
276
-
277
-
278
-
279
-
280
-
281
-
282
-
283
-
284
-
285
-
286
-
287
-
288
-
289
-
290
-
291
-
292
-
293
-
294
-
295
-
296
-
297
-
298
-
299
-
300
-
301
-
302
 |
 |

Change
Year ended December 31, 2013 vs.
2012
2012 vs.
20112013 2012 2011 2010(1) 2009
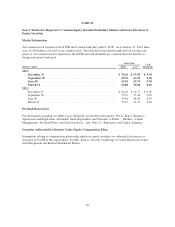
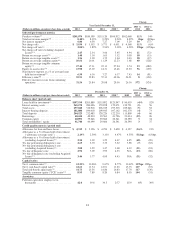
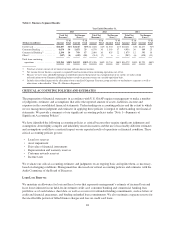
Managed metrics(25)
Average loans held for investment ........... $192,614 $187,915 $128,424 $128,622 $143,514 3% 46%
Average interest-earning assets ............. 266,423 255,079 175,341 175,757 186,218 445
Period-end loans:
Period-end on-balance sheet loans held for
investment ........................ 197,199 205,889 135,892 125,947 90,619 (4) 52
Period-end off-balance sheet securitized
loans ............................ —— — — 46,184 ——
Total period-end managed loans ............. $197,199 $205,889 $135,892 $125,947 $136,803 (4)% 52%
Period-end total loan accounts (in millions) .... 95.6 122.1 70.0 37.4 37.8 (22)% 74%
30+ day performing delinquency rate ......... 2.63% 2.70% 3.35% 3.52% 4.62% (7)bps (65)bps
Net charge-off rate ....................... 2.04 1.89 2.94 5.18 5.87 15 (105)
Non-interest expense as a % of average loans
held for investment(19) ................... 6.50 6.36 7.27 6.17 5.17 14 (91)
Efficiency ratio. ......................... 55.91 55.83 57.33 49.06 43.35 8(150)
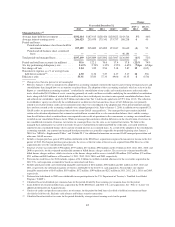
** Change is less than one percent or not meaningful.
(1) Effective January 1, 2010, we prospectively adopted two accounting standards related to the transfer and servicing of financial assets and
consolidations that changed how we account for securitized loans. The adoption of these accounting standards, which we refer to in this
Report as “consolidation accounting standards,” resulted in the consolidation of our credit card securitization trusts and certain other
trusts, which added $41.9 billion of assets, consisting primarily of credit card loan receivables underlying the consolidated securitization
trusts, along with $44.3 billion of related debt issued by these trusts to third-party investors to our reported consolidated balance sheets
and reduced our stockholders’ equity by $2.9 billion and reduced our Tier 1 risk-based capital ratio to 9.9% from 13.8%. The reduction
to stockholders’ equity was driven by the establishment of an allowance for loan and lease losses of $4.3 billion (pre-tax) primarily
related to receivables held in credit card securitization trusts that were consolidated at the adoption date. Prior period reported amounts
have not been restated as the accounting standards were adopted prospectively. Prior to January 1, 2010, in addition to our reported U.S.
GAAP results, we presented and analyzed our results on a non-GAAP “managed basis.” Our managed-basis presentation included
certain reclassification adjustments that assumed securitized loans accounted for as sales remained on balance sheet, and the earnings
from the off-balance sheet securitized loans were reported in our results of operations in the same manner as earnings on retained loans
recorded on our consolidated balance sheets. While our managed presentation resulted in differences in the classification of revenues in
our consolidated statements of income, net income on a managed basis was the same as our reported net income. We believe this
managed-basis information was useful to investors because it enabled them to understand both the credit risks associated with loans
reported on our consolidated balance sheets and our retained interests in securitized loans. As a result of the adoption of the consolidation
accounting standards, our reported and managed based presentations are generally comparable for periods beginning after January 1,
2010. See “MD&A—Supplemental Tables” and “Exhibit 99.1” for additional information on our non-GAAP managed presentation and
other non- GAAP measures.
(2) Includes a bargain purchase gain of $594 million attributable to the ING Direct acquisition recognized in non-interest income in the first
quarter of 2012. The bargain purchase gain represents the excess of the fair value of the net assets acquired from ING Direct as of the
acquisition date over the consideration transferred.
(3) Total net revenue was reduced by $796 million, $937 million, $371 million, $950 million and $2.1 billion in 2013, 2012, 2011, 2010, and
2009, respectively, for the estimated uncollectible amount of billed finance charges and fees. The reserve for estimated uncollectible
billed finance charges and fees, which we refer to as the finance charge and fee reserve, totaled $190 million, $307 million, $74 million,
$211 million and $624 million as of December 31, 2013, 2012, 2011, 2010, and 2009, respectively.
(4) Provision for credit losses for 2012 includes expense of $1.2 billion to establish an initial allowance for the receivables acquired in the
2012 U.S. card acquisition accounted for based on contractual cash flows.
(5) Includes purchased credit card relationship intangible amortization of $434 million, $350 million and $21 million in 2013, 2012 and
2011, respectively, the substantial majority of which is attributable to the 2012 U.S. card acquisition. Also includes core deposit
intangible amortization of $165 million, $193 million, $172 million, $199 million and $212 million in 2013, 2012, 2011, 2010, and 2009,
respectively.
(6) Preferred stock dividends in 2009 were attributable to our participation in the U.S. Department of Treasury’s Troubled Asset Relief
Program (“TARP”).
(7) Calculated based on dividends per common share for the period divided by basic earnings per common share for the period.
(8) Loans held for investment includes loans acquired in the CCB, ING Direct and 2012 U.S. card acquisitions. See “Note 4—Loans” for
additional information on Acquired Loans.
(9) Consists of credit card purchase transactions, net of returns, for the period for both loans classified as held for investment and loans
classified as held for sale. Excludes cash advance and balance transfer transactions.
(10) Calculated based on total net revenue for the period divided by average interest-earning assets for the period.
42