Capital One 2013 Annual Report Download - page 97
Download and view the complete annual report
Please find page 97 of the 2013 Capital One annual report below. You can navigate through the pages in the report by either clicking on the pages listed below, or by using the keyword search tool below to find specific information within the annual report.-
 1
1 -
2
-
3
-
4
-
5
-
6
-
7
-
8
-
9
-
10
-
11
-
12
-
13
-
14
-
15
-
16
-
17
-
18
-
19
-
20
-
21
-
22
-
23
-
24
-
25
-
26
-
27
-
28
-
29
-
30
-
31
-
32
-
33
-
34
-
35
-
36
-
37
-
38
-
39
-
40
-
41
-
42
-
43
-
44
-
45
-
46
-
47
-
48
-
49
-
50
-
51
-
52
-
53
-
54
-
55
-
56
-
57
-
58
-
59
-
60
-
61
-
62
-
63
-
64
-
65
-
66
-
67
-
68
-
69
-
70
-
71
-
72
-
73
-
74
-
75
-
76
-
77
-
78
-
79
-
80
-
81
-
82
-
83
-
84
-
85
-
86
-
 87
87 -
 88
88 -
 89
89 -
 90
90 -
 91
91 -
 92
92 -
 93
93 -
 94
94 -
 95
95 -
 96
96 -
 97
97 -
 98
98 -
 99
99 -
 100
100 -
 101
101 -
 102
102 -
 103
103 -
 104
104 -
 105
105 -
 106
106 -
 107
107 -
108
-
109
-
110
-
111
-
112
-
113
-
114
-
115
-
116
-
117
-
118
-
119
-
120
-
121
-
122
-
123
-
124
-
125
-
126
-
127
-
128
-
129
-
130
-
131
-
132
-
133
-
134
-
135
-
136
-
137
-
138
-
139
-
140
-
141
-
142
-
143
-
144
-
145
-
146
-
147
-
148
-
149
-
150
-
151
-
152
-
153
-
154
-
155
-
156
-
157
-
158
-
159
-
160
-
161
-
162
-
163
-
164
-
165
-
166
-
167
-
168
-
169
-
170
-
171
-
172
-
173
-
174
-
175
-
176
-
177
-
178
-
179
-
180
-
181
-
182
-
183
-
184
-
185
-
186
-
187
-
188
-
189
-
190
-
191
-
192
-
193
-
194
-
195
-
196
-
197
-
198
-
199
-
200
-
201
-
202
-
203
-
204
-
205
-
206
-
207
-
208
-
209
-
210
-
211
-
212
-
213
-
214
-
215
-
216
-
217
-
218
-
219
-
220
-
221
-
222
-
223
-
224
-
225
-
226
-
227
-
228
-
229
-
230
-
231
-
232
-
233
-
234
-
235
-
236
-
237
-
238
-
239
-
240
-
241
-
242
-
243
-
244
-
245
-
246
-
247
-
248
-
249
-
250
-
251
-
252
-
253
-
254
-
255
-
256
-
257
-
258
-
259
-
260
-
261
-
262
-
263
-
264
-
265
-
266
-
267
-
268
-
269
-
270
-
271
-
272
-
273
-
274
-
275
-
276
-
277
-
278
-
279
-
280
-
281
-
282
-
283
-
284
-
285
-
286
-
287
-
288
-
289
-
290
-
291
-
292
-
293
-
294
-
295
-
296
-
297
-
298
-
299
-
300
-
301
-
302
 |
 |
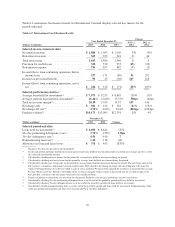
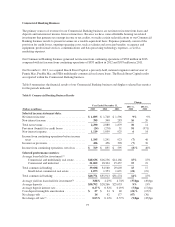
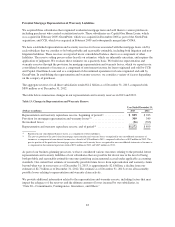
driven by strong loan originations in the commercial lending business, which was partially offset by the
continued run-off of the small-ticket commercial real estate loan portfolio.
•Deposits: Period-end deposits in the Commercial Banking business increased by $701 million, or 2%, to
$30.6 billion as of December 31, 2013, from $29.9 billion as of December 31, 2012, driven by our strategy
to strengthen existing relationships and increase liquidity from commercial customers.
•Charge-off Statistics: The net charge-off rate was 0.03% in 2013, compared to 0.12% in 2012. The
nonperforming loan rate decreased to 0.33% as of December 31, 2013, from 0.73% as of December 31,
2012. The continued strength in the credit metrics in our Commercial Banking business reflected stable
credit trends and underlying collateral values.
Key factors affecting the results of our Commercial Banking business for 2012, compared with 2011, and
changes in financial condition and credit performance between December 31, 2012 and December 31, 2011
include the following:
•Net Interest Income: Net interest income increased by $144 million, or 9%, in 2012. The increase was
primarily driven by higher deposit balances and growth in commercial real estate and commercial and
industrial loans.
•Non-Interest Income: Non-interest income increased by $57 million or 20%, in 2012, largely attributable to
growth in fees from services provided to customers.
•Provision for Credit Losses: The Commercial Banking business recorded a benefit related to the provision
for credit losses of $270 million in 2012, compared with a provision of credit losses of $31 million in 2011.
The benefit recorded in 2012 reflected a significant decrease in net charge-offs, resulting in an increase in
allowance releases attributable to the improvement in underlying credit performance trends. We recorded a
release of the combined allowance for loan losses and reserve for unfunded lending commitments of $313
million in 2012, compared with a release of $147 million in 2011.
•Non-Interest Expense: Non-interest expense increased by $134 million, or 14%, in 2012. The increase was
due to costs associated with higher originations in our commercial real estate and commercial and industrial
businesses, expansion into new markets and infrastructure investments.
•Loans Held for Investment: Period-end loans increased by $4.5 billion, or 13%, in 2012 to $38.8 billion as
of December 31, 2012. The increase was driven by stronger loan originations in the commercial and
industrial and commercial real estate businesses, which was partially offset by the run-off and sale of a
portion of the small-ticket commercial real estate loan portfolio.
•Deposits: Period-end deposits in the Commercial Banking business increased by $3.2 billion, or 12%, in
2012 to $29.9 billion as of December 31, 2012, driven by our strategy to strengthen existing relationships
and increase liquidity from commercial customers.
•Charge-off Statistics: The net charge-off rate decreased to 0.12% in 2012, from 0.57% in 2011. The
nonperforming loan rate decreased to 0.73% as of December 31, 2012, from 1.08% as of December 31,
2011. The significant improvement in the credit metrics in our Commercial Banking business reflected a
continued improvement in credit trends and strengthening of underlying collateral values, resulting in lower
loss severities and opportunities for recoveries on previously charged-off loans.
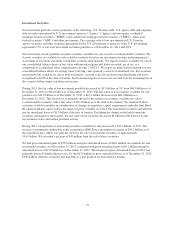
“Other” Category
Other includes unallocated amounts related to our centralized Corporate Treasury group activities, such as
management of our corporate investment portfolio and asset/liability management. Gains and losses on our
investment securities portfolio and certain trading activities are included in the Other category. The Other
category also includes foreign exchange-rate fluctuations related to the revaluation of foreign currency-
denominated investments; certain gains and losses on the sale and securitization of loans; unallocated corporate
77