Capital One 2013 Annual Report Download - page 123
Download and view the complete annual report
Please find page 123 of the 2013 Capital One annual report below. You can navigate through the pages in the report by either clicking on the pages listed below, or by using the keyword search tool below to find specific information within the annual report.-
 1
1 -
2
-
3
-
4
-
5
-
6
-
7
-
8
-
9
-
10
-
11
-
12
-
13
-
14
-
15
-
16
-
17
-
18
-
19
-
20
-
21
-
22
-
23
-
24
-
25
-
26
-
27
-
28
-
29
-
30
-
31
-
32
-
33
-
34
-
35
-
36
-
37
-
38
-
39
-
40
-
41
-
42
-
43
-
44
-
45
-
46
-
47
-
48
-
49
-
50
-
51
-
52
-
53
-
54
-
55
-
56
-
57
-
58
-
59
-
60
-
61
-
62
-
63
-
64
-
65
-
66
-
67
-
68
-
69
-
70
-
71
-
72
-
73
-
74
-
75
-
76
-
77
-
78
-
79
-
80
-
81
-
82
-
83
-
84
-
85
-
86
-
87
-
88
-
89
-
90
-
91
-
92
-
93
-
94
-
95
-
96
-
97
-
98
-
99
-
100
-
101
-
102
-
103
-
104
-
105
-
106
-
107
-
108
-
109
-
110
-
111
-
112
-
 113
113 -
 114
114 -
 115
115 -
 116
116 -
 117
117 -
 118
118 -
 119
119 -
 120
120 -
 121
121 -
 122
122 -
 123
123 -
 124
124 -
 125
125 -
 126
126 -
 127
127 -
 128
128 -
 129
129 -
 130
130 -
 131
131 -
 132
132 -
 133
133 -
134
-
135
-
136
-
137
-
138
-
139
-
140
-
141
-
142
-
143
-
144
-
145
-
146
-
147
-
148
-
149
-
150
-
151
-
152
-
153
-
154
-
155
-
156
-
157
-
158
-
159
-
160
-
161
-
162
-
163
-
164
-
165
-
166
-
167
-
168
-
169
-
170
-
171
-
172
-
173
-
174
-
175
-
176
-
177
-
178
-
179
-
180
-
181
-
182
-
183
-
184
-
185
-
186
-
187
-
188
-
189
-
190
-
191
-
192
-
193
-
194
-
195
-
196
-
197
-
198
-
199
-
200
-
201
-
202
-
203
-
204
-
205
-
206
-
207
-
208
-
209
-
210
-
211
-
212
-
213
-
214
-
215
-
216
-
217
-
218
-
219
-
220
-
221
-
222
-
223
-
224
-
225
-
226
-
227
-
228
-
229
-
230
-
231
-
232
-
233
-
234
-
235
-
236
-
237
-
238
-
239
-
240
-
241
-
242
-
243
-
244
-
245
-
246
-
247
-
248
-
249
-
250
-
251
-
252
-
253
-
254
-
255
-
256
-
257
-
258
-
259
-
260
-
261
-
262
-
263
-
264
-
265
-
266
-
267
-
268
-
269
-
270
-
271
-
272
-
273
-
274
-
275
-
276
-
277
-
278
-
279
-
280
-
281
-
282
-
283
-
284
-
285
-
286
-
287
-
288
-
289
-
290
-
291
-
292
-
293
-
294
-
295
-
296
-
297
-
298
-
299
-
300
-
301
-
302
 |
 |
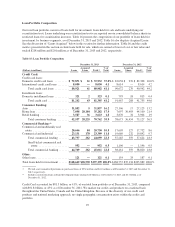
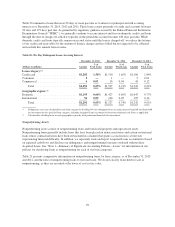
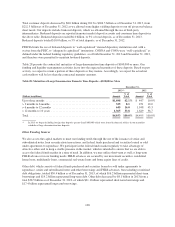
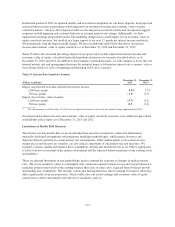
Home loan modifications represented $244 million, or 15%, of the outstanding balance of total modified loans as
of December 31, 2013, compared with $145 million, or 8%, of the outstanding balance of total modified loans as
of December 31, 2012. The majority of our modified home loans involve a combination of an interest rate
reduction, term extension or principal forbearance.
Retail banking loan modifications represented $64 million, or 4%, of the outstanding balance of total modified
loans as of December 31, 2013 compared with $65 million, or 4%, of the outstanding balance of total loans as of
December 31, 2012.
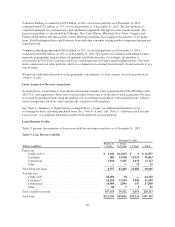
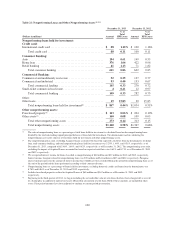
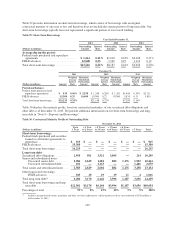
Commercial loan modifications represented $238 million, or 14%, of the outstanding balance of total modified
loans as of December 31, 2013, compared with $383 million, or 21%, of the outstanding balance of total
modified loans as of December 31, 2012. The vast majority of modified commercial loans include a reduction in
interest rate or a term extension.
We provide additional information on modified loans accounted for as TDRs, including the performance of those
loans subsequent to modification, in “Note 4—Loans.”
Impaired Loans
A loan is considered impaired when, based on current information and events, it is probable that we will be
unable to collect all amounts due from the borrower in accordance with the original contractual terms of the loan.
Generally, we report loans as impaired based on the method for measuring impairment in accordance with
applicable accounting guidance. Loans defined as individually impaired, include larger balance commercial
nonperforming loans and TDR loans. Loans held for sale are not reported as impaired, as these loans are recorded
at lower of cost or fair value. Impaired loans also exclude Acquired Loans accounted for based on estimated cash
flows because this accounting methodology takes into consideration future credit losses expected to be incurred,
as discussed above under “Summary of Selected Financial Data.”
Impaired loans, including TDRs, totaled $1.9 billion as of December 31, 2013, compared with $2.0 billion as of
December 31, 2012. TDRs accounted for $1.7 billion and $1.8 billion of impaired loans as of December 31, 2013
and 2012, respectively. We provide additional information on our impaired loans, including the allowance
established for these loans, in “Note 4—Loans” and “Note 5—Allowance for Loan and Lease Losses.”
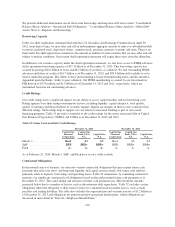
Allowance for Loan and Lease Losses
Our allowance for loan and lease losses represents management’s best estimate of incurred loan and lease credit
losses inherent in our held for investment portfolio as of each balance sheet date. We provide additional
information on the methodologies and key assumptions used in determining our allowance for loan and lease
losses in “Note 1—Summary of Significant Accounting Policies.”
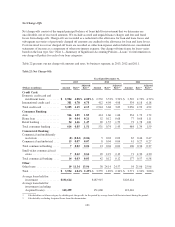
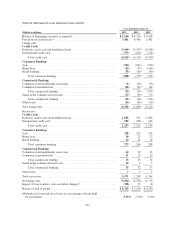
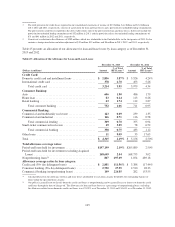
Table 24 displays changes in our allowance for loan and lease losses for 2013, 2012 and 2011, which details by
loan type, the provision for credit losses recognized in our consolidated statements of income each period and
charge-offs recorded against the allowance for loan and lease losses.
103