Capital One 2013 Annual Report Download - page 282
Download and view the complete annual report
Please find page 282 of the 2013 Capital One annual report below. You can navigate through the pages in the report by either clicking on the pages listed below, or by using the keyword search tool below to find specific information within the annual report.-
 1
1 -
 2
2 -
 3
3 -
 4
4 -
 5
5 -
 6
6 -
 7
7 -
 8
8 -
 9
9 -
 10
10 -
 11
11 -
 12
12 -
 13
13 -
 14
14 -
 15
15 -
 16
16 -
 17
17 -
 18
18 -
 19
19 -
 20
20 -
 21
21 -
 22
22 -
 23
23 -
 24
24 -
 25
25 -
 26
26 -
 27
27 -
 28
28 -
 29
29 -
 30
30 -
 31
31 -
 32
32 -
 33
33 -
 34
34 -
 35
35 -
 36
36 -
 37
37 -
 38
38 -
 39
39 -
 40
40 -
 41
41 -
 42
42 -
 43
43 -
 44
44 -
 45
45 -
 46
46 -
 47
47 -
 48
48 -
 49
49 -
 50
50 -
 51
51 -
 52
52 -
 53
53 -
 54
54 -
 55
55 -
 56
56 -
 57
57 -
 58
58 -
 59
59 -
 60
60 -
 61
61 -
 62
62 -
 63
63 -
 64
64 -
 65
65 -
 66
66 -
 67
67 -
 68
68 -
 69
69 -
 70
70 -
 71
71 -
 72
72 -
 73
73 -
 74
74 -
 75
75 -
 76
76 -
 77
77 -
 78
78 -
 79
79 -
 80
80 -
 81
81 -
 82
82 -
 83
83 -
 84
84 -
 85
85 -
 86
86 -
 87
87 -
 88
88 -
 89
89 -
 90
90 -
 91
91 -
 92
92 -
 93
93 -
 94
94 -
 95
95 -
 96
96 -
 97
97 -
 98
98 -
 99
99 -
 100
100 -
 101
101 -
 102
102 -
 103
103 -
 104
104 -
 105
105 -
 106
106 -
 107
107 -
 108
108 -
 109
109 -
 110
110 -
 111
111 -
 112
112 -
 113
113 -
 114
114 -
 115
115 -
 116
116 -
 117
117 -
 118
118 -
 119
119 -
 120
120 -
 121
121 -
 122
122 -
 123
123 -
 124
124 -
 125
125 -
 126
126 -
 127
127 -
 128
128 -
 129
129 -
 130
130 -
 131
131 -
 132
132 -
 133
133 -
 134
134 -
 135
135 -
 136
136 -
 137
137 -
 138
138 -
 139
139 -
 140
140 -
 141
141 -
 142
142 -
 143
143 -
 144
144 -
 145
145 -
 146
146 -
 147
147 -
 148
148 -
 149
149 -
 150
150 -
 151
151 -
 152
152 -
 153
153 -
 154
154 -
 155
155 -
 156
156 -
 157
157 -
 158
158 -
 159
159 -
 160
160 -
 161
161 -
 162
162 -
 163
163 -
 164
164 -
 165
165 -
 166
166 -
 167
167 -
 168
168 -
 169
169 -
 170
170 -
 171
171 -
 172
172 -
 173
173 -
 174
174 -
 175
175 -
 176
176 -
 177
177 -
 178
178 -
 179
179 -
 180
180 -
 181
181 -
 182
182 -
 183
183 -
 184
184 -
 185
185 -
 186
186 -
 187
187 -
 188
188 -
 189
189 -
 190
190 -
 191
191 -
 192
192 -
 193
193 -
 194
194 -
 195
195 -
 196
196 -
 197
197 -
 198
198 -
 199
199 -
 200
200 -
 201
201 -
 202
202 -
 203
203 -
 204
204 -
 205
205 -
 206
206 -
 207
207 -
 208
208 -
 209
209 -
 210
210 -
 211
211 -
 212
212 -
 213
213 -
 214
214 -
 215
215 -
 216
216 -
 217
217 -
 218
218 -
 219
219 -
 220
220 -
 221
221 -
 222
222 -
 223
223 -
 224
224 -
 225
225 -
 226
226 -
 227
227 -
 228
228 -
 229
229 -
 230
230 -
 231
231 -
 232
232 -
 233
233 -
 234
234 -
 235
235 -
 236
236 -
 237
237 -
 238
238 -
 239
239 -
 240
240 -
 241
241 -
 242
242 -
 243
243 -
 244
244 -
 245
245 -
 246
246 -
 247
247 -
 248
248 -
 249
249 -
 250
250 -
 251
251 -
 252
252 -
 253
253 -
 254
254 -
 255
255 -
 256
256 -
 257
257 -
 258
258 -
 259
259 -
 260
260 -
 261
261 -
 262
262 -
 263
263 -
 264
264 -
 265
265 -
 266
266 -
 267
267 -
 268
268 -
 269
269 -
 270
270 -
 271
271 -
 272
272 -
 273
273 -
 274
274 -
 275
275 -
 276
276 -
 277
277 -
 278
278 -
 279
279 -
 280
280 -
 281
281 -
 282
282 -
 283
283 -
 284
284 -
 285
285 -
 286
286 -
 287
287 -
 288
288 -
 289
289 -
 290
290 -
 291
291 -
 292
292 -
 293
293 -
 294
294 -
 295
295 -
 296
296 -
 297
297 -
 298
298 -
 299
299 -
 300
300 -
 301
301 -
 302
302
 |
 |

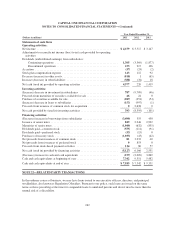
CAPITAL ONE FINANCIAL CORPORATION
NOTES TO CONSOLIDATED FINANCIAL STATEMENTS—(Continued)
Year Ended December 31,
(Dollars in millions) 2013 2012 2011
Statements of cash flows
Operating activities:
Net income ......................................................... $ 4,159 $ 3,517 $ 3,147
Adjustments to reconcile net income (loss) to net cash provided by operating
activities:
Dividends (undistributed earnings) from subsidiaries:
Continuing operations ............................................ 1,305 (3,569) (1,877)
Discontinued operations ........................................... 233 217 106
Accretion .......................................................... (57) (24) (2)
Stock plan compensation expense ....................................... 143 112 92
Decrease (increase) in other assets ....................................... (818) 1 (65)
Increase (decrease) in other liabilities .................................... (388) (34) 18
Net cash (used in) provided by operating activities .......................... 4,577 220 1,419
Investing activities:
(Increase) decrease in investment in subsidiaries ........................... 787 (9,709) (46)
Proceeds from maturities of securities available for sale ...................... 46 24 0
Purchase of securities available for sale ................................... (287) (351) (54)
(Increase) decrease in loans to subsidiaries ................................ (153) (997) (1)
Proceeds from issuance of common stock for acquisition ..................... 02,638 0
Net cash provided by (used in) investing activities .......................... 393 (8,395) (101)
Financing activities:
(Decrease) increase in borrowings from subsidiaries ........................ (3,490) 555 450
Issuance of senior notes ............................................... 849 2,246 2,992
Maturities of senior notes .............................................. (1,040) (632) (855)
Dividends paid—common stock ........................................ (555) (111) (91)
Dividends paid—preferred stock ........................................ (53) (15) 0
Purchases of treasury stock ............................................ (1,033) (43) (42)
Net proceeds from issuances of common stock ............................. 81 3,233 40
Net proceeds from issuances of preferred stock ............................ 0853 0
Proceeds from stock-based payment activities ............................. 114 80 57
Net cash (used in) provided by financing activities .......................... (5,127) 6,166 2,551
(Decrease) increase in cash and cash equivalents ........................... (157) (2,009) 3,869
Cash and cash equivalents at beginning of year ............................. 7,342 9,351 5,482
Cash and cash equivalents at end of year .................................. $ 7,185 $ 7,342 $ 9,351
NOTE 22—RELATED PARTY TRANSACTIONS
In the ordinary course of business, we may have loans issued to our executive officers, directors, and principal
stockholders, also known as Regulation O Insiders. Pursuant to our policy, such loans are issued on the same
terms as those prevailing at the time for comparable loans to unrelated persons and do not involve more than the
normal risk of collectability.
262
