Capital One 2013 Annual Report Download - page 100
Download and view the complete annual report
Please find page 100 of the 2013 Capital One annual report below. You can navigate through the pages in the report by either clicking on the pages listed below, or by using the keyword search tool below to find specific information within the annual report.-
 1
1 -
2
-
3
-
4
-
5
-
6
-
7
-
8
-
9
-
10
-
11
-
12
-
13
-
14
-
15
-
16
-
17
-
18
-
19
-
20
-
21
-
22
-
23
-
24
-
25
-
26
-
27
-
28
-
29
-
30
-
31
-
32
-
33
-
34
-
35
-
36
-
37
-
38
-
39
-
40
-
41
-
42
-
43
-
44
-
45
-
46
-
47
-
48
-
49
-
50
-
51
-
52
-
53
-
54
-
55
-
56
-
57
-
58
-
59
-
60
-
61
-
62
-
63
-
64
-
65
-
66
-
67
-
68
-
69
-
70
-
71
-
72
-
73
-
74
-
75
-
76
-
77
-
78
-
79
-
80
-
81
-
82
-
83
-
84
-
85
-
86
-
87
-
88
-
89
-
 90
90 -
 91
91 -
 92
92 -
 93
93 -
 94
94 -
 95
95 -
 96
96 -
 97
97 -
 98
98 -
 99
99 -
 100
100 -
 101
101 -
 102
102 -
 103
103 -
 104
104 -
 105
105 -
 106
106 -
 107
107 -
 108
108 -
 109
109 -
 110
110 -
111
-
112
-
113
-
114
-
115
-
116
-
117
-
118
-
119
-
120
-
121
-
122
-
123
-
124
-
125
-
126
-
127
-
128
-
129
-
130
-
131
-
132
-
133
-
134
-
135
-
136
-
137
-
138
-
139
-
140
-
141
-
142
-
143
-
144
-
145
-
146
-
147
-
148
-
149
-
150
-
151
-
152
-
153
-
154
-
155
-
156
-
157
-
158
-
159
-
160
-
161
-
162
-
163
-
164
-
165
-
166
-
167
-
168
-
169
-
170
-
171
-
172
-
173
-
174
-
175
-
176
-
177
-
178
-
179
-
180
-
181
-
182
-
183
-
184
-
185
-
186
-
187
-
188
-
189
-
190
-
191
-
192
-
193
-
194
-
195
-
196
-
197
-
198
-
199
-
200
-
201
-
202
-
203
-
204
-
205
-
206
-
207
-
208
-
209
-
210
-
211
-
212
-
213
-
214
-
215
-
216
-
217
-
218
-
219
-
220
-
221
-
222
-
223
-
224
-
225
-
226
-
227
-
228
-
229
-
230
-
231
-
232
-
233
-
234
-
235
-
236
-
237
-
238
-
239
-
240
-
241
-
242
-
243
-
244
-
245
-
246
-
247
-
248
-
249
-
250
-
251
-
252
-
253
-
254
-
255
-
256
-
257
-
258
-
259
-
260
-
261
-
262
-
263
-
264
-
265
-
266
-
267
-
268
-
269
-
270
-
271
-
272
-
273
-
274
-
275
-
276
-
277
-
278
-
279
-
280
-
281
-
282
-
283
-
284
-
285
-
286
-
287
-
288
-
289
-
290
-
291
-
292
-
293
-
294
-
295
-
296
-
297
-
298
-
299
-
300
-
301
-
302
 |
 |

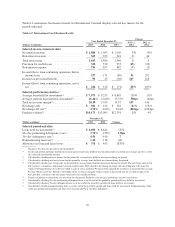
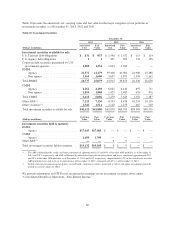
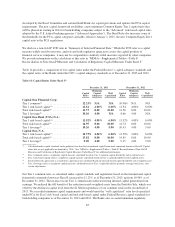
Table 10 presents the amortized cost, carrying value and fair value for the major categories of our portfolio of
investment securities as of December 31, 2013, 2012 and 2011.
Table 10: Investment Securities
December 31,
2013 2012 2011
(Dollars in millions)
Amortized
Cost
Fair
Value
Amortized
Cost
Fair
Value
Amortized
Cost
Fair
Value
Investment securities available for sale
U.S. Treasury debt obligations ............. $ 831 $ 833 $ 1,548 $ 1,552 $ 115 $ 124
U.S. Agency debt obligations .............. 11301 302 131 138
Corporate debt securities guaranteed by U.S.
government agencies .................. 1,282 1,234 1,003 1,012 — —
RMBS:
Agency ........................... 21,572 21,479 39,408 40,002 24,980 25,488
Non-agency ........................ 3,165 3,600 3,607 3,871 1,340 1,162
Total RMBS ........................... 24,737 25,079 43,015 43,873 26,320 26,650
CMBS:
Agency ........................... 4,262 4,198 6,045 6,144 697 711
Non-agency ........................ 1,854 1,808 1,425 1,485 459 476
Total CMBS ........................... 6,116 6,006 7,470 7,629 1,156 1,187
Other ABS(1) ........................... 7,123 7,136 8,393 8,458 10,119 10,150
Other securities(2) ....................... 1,542 1,511 1,120 1,153 462 510
Total investment securities available for sale . . $41,632 $41,800 $62,850 $63,979 $38,303 $38,759
(Dollars in millions)
Carrying
Value
Fair
Value
Carrying
Value
Fair
Value
Carrying
Value
Fair
Value
Investment securities held to maturity
RMBS:
Agency ........................... $17,443 $17,485 $—$—$—$—
CMBS:
Agency ........................... 1,689 1,700 ————
Other ABS(1) ........................... —— 9 9——
Total investment securities held to maturity . . . $19,132 $19,185 $ 9$ 9$ —$ —
(1) The ABS collateralized by credit card loans constituted of approximately 65% and 64% of the other ABS portfolio, as of December 31,
2013 and 2012, respectively, and ABS collaterized by auto dealer floor plan inventory loans and leases constituted approximately 15%
and 18% of the other ABS portfolio, as of December 31, 2013 and 2012, respectively. Approximately 87% of the securities in our other
ABS portfolio were rated AAA or its equivalent as of December 31, 2013, compared with 82% as of December 31, 2012.
(2) Includes foreign government/agency bonds, covered bonds, corporate securities, municipal securities and equity investments primarily
related to activities under the CRA.
We provide information on OTTI losses recognized in earnings on our investment securities above under
“Consolidated Results of Operations—Non-Interest Income.”
80