Capital One 2013 Annual Report Download - page 299
Download and view the complete annual report
Please find page 299 of the 2013 Capital One annual report below. You can navigate through the pages in the report by either clicking on the pages listed below, or by using the keyword search tool below to find specific information within the annual report.-
 1
1 -
2
-
3
-
4
-
5
-
6
-
7
-
8
-
9
-
10
-
11
-
12
-
13
-
14
-
15
-
16
-
17
-
18
-
19
-
20
-
21
-
22
-
23
-
24
-
25
-
26
-
27
-
28
-
29
-
30
-
31
-
32
-
33
-
34
-
35
-
36
-
37
-
38
-
39
-
40
-
41
-
42
-
43
-
44
-
45
-
46
-
47
-
48
-
49
-
50
-
51
-
52
-
53
-
54
-
55
-
56
-
57
-
58
-
59
-
60
-
61
-
62
-
63
-
64
-
65
-
66
-
67
-
68
-
69
-
70
-
71
-
72
-
73
-
74
-
75
-
76
-
77
-
78
-
79
-
80
-
81
-
82
-
83
-
84
-
85
-
86
-
87
-
88
-
89
-
90
-
91
-
92
-
93
-
94
-
95
-
96
-
97
-
98
-
99
-
100
-
101
-
102
-
103
-
104
-
105
-
106
-
107
-
108
-
109
-
110
-
111
-
112
-
113
-
114
-
115
-
116
-
117
-
118
-
119
-
120
-
121
-
122
-
123
-
124
-
125
-
126
-
127
-
128
-
129
-
130
-
131
-
132
-
133
-
134
-
135
-
136
-
137
-
138
-
139
-
140
-
141
-
142
-
143
-
144
-
145
-
146
-
147
-
148
-
149
-
150
-
151
-
152
-
153
-
154
-
155
-
156
-
157
-
158
-
159
-
160
-
161
-
162
-
163
-
164
-
165
-
166
-
167
-
168
-
169
-
170
-
171
-
172
-
173
-
174
-
175
-
176
-
177
-
178
-
179
-
180
-
181
-
182
-
183
-
184
-
185
-
186
-
187
-
188
-
189
-
190
-
191
-
192
-
193
-
194
-
195
-
196
-
197
-
198
-
199
-
200
-
201
-
202
-
203
-
204
-
205
-
206
-
207
-
208
-
209
-
210
-
211
-
212
-
213
-
214
-
215
-
216
-
217
-
218
-
219
-
220
-
221
-
222
-
223
-
224
-
225
-
226
-
227
-
228
-
229
-
230
-
231
-
232
-
233
-
234
-
235
-
236
-
237
-
238
-
239
-
240
-
241
-
242
-
243
-
244
-
245
-
246
-
247
-
248
-
249
-
250
-
251
-
252
-
253
-
254
-
255
-
256
-
257
-
258
-
259
-
260
-
261
-
262
-
263
-
264
-
265
-
266
-
267
-
268
-
269
-
270
-
271
-
272
-
273
-
274
-
275
-
276
-
277
-
278
-
279
-
280
-
281
-
282
-
283
-
284
-
285
-
286
-
287
-
288
-
 289
289 -
 290
290 -
 291
291 -
 292
292 -
 293
293 -
 294
294 -
 295
295 -
 296
296 -
 297
297 -
 298
298 -
 299
299 -
 300
300 -
 301
301 -
 302
302
 |
 |

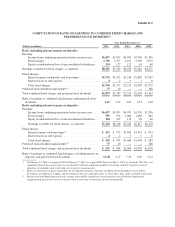
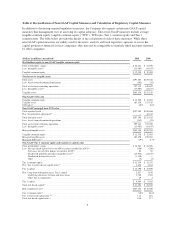
(1) Includes impact from related deferred taxes.
(2) Calculated based on tangible common equity divided by tangible assets.
(3) Reflects the adjustment to reported total consolidated assets to reflect loans underlying off-balance sheet securitized trusts in the same
manner as on-balance sheet loans.
(4) Amounts presented are net of tax.
(5) Disallowed goodwill and other intangible assets are net of related deferred tax liability.
(6) Consists primarily of trust preferred securities.
(7) Total risk-based capital equals the sum of Tier 1 capital and Tier 2 capital.
(8) Calculated based on prescribed regulatory guidelines.
(9) Tier 1 common ratio is a non-GAAP measure calculated based on Tier 1 common equity divided by risk-weighted assets.
(10) Tier 1 risk-based capital ratio is a regulatory capital measure calculated based on Tier 1 capital divided by risk-weighted assets.
(11) Total risk-based capital ratio is a regulatory capital measure calculated based on Total risk-based capital divided by risk-weighted assets.
6