Capital One 2013 Annual Report Download - page 219
Download and view the complete annual report
Please find page 219 of the 2013 Capital One annual report below. You can navigate through the pages in the report by either clicking on the pages listed below, or by using the keyword search tool below to find specific information within the annual report.-
 1
1 -
2
-
3
-
4
-
5
-
6
-
7
-
8
-
9
-
10
-
11
-
12
-
13
-
14
-
15
-
16
-
17
-
18
-
19
-
20
-
21
-
22
-
23
-
24
-
25
-
26
-
27
-
28
-
29
-
30
-
31
-
32
-
33
-
34
-
35
-
36
-
37
-
38
-
39
-
40
-
41
-
42
-
43
-
44
-
45
-
46
-
47
-
48
-
49
-
50
-
51
-
52
-
53
-
54
-
55
-
56
-
57
-
58
-
59
-
60
-
61
-
62
-
63
-
64
-
65
-
66
-
67
-
68
-
69
-
70
-
71
-
72
-
73
-
74
-
75
-
76
-
77
-
78
-
79
-
80
-
81
-
82
-
83
-
84
-
85
-
86
-
87
-
88
-
89
-
90
-
91
-
92
-
93
-
94
-
95
-
96
-
97
-
98
-
99
-
100
-
101
-
102
-
103
-
104
-
105
-
106
-
107
-
108
-
109
-
110
-
111
-
112
-
113
-
114
-
115
-
116
-
117
-
118
-
119
-
120
-
121
-
122
-
123
-
124
-
125
-
126
-
127
-
128
-
129
-
130
-
131
-
132
-
133
-
134
-
135
-
136
-
137
-
138
-
139
-
140
-
141
-
142
-
143
-
144
-
145
-
146
-
147
-
148
-
149
-
150
-
151
-
152
-
153
-
154
-
155
-
156
-
157
-
158
-
159
-
160
-
161
-
162
-
163
-
164
-
165
-
166
-
167
-
168
-
169
-
170
-
171
-
172
-
173
-
174
-
175
-
176
-
177
-
178
-
179
-
180
-
181
-
182
-
183
-
184
-
185
-
186
-
187
-
188
-
189
-
190
-
191
-
192
-
193
-
194
-
195
-
196
-
197
-
198
-
199
-
200
-
201
-
202
-
203
-
204
-
205
-
206
-
207
-
208
-
 209
209 -
 210
210 -
 211
211 -
 212
212 -
 213
213 -
 214
214 -
 215
215 -
 216
216 -
 217
217 -
 218
218 -
 219
219 -
 220
220 -
 221
221 -
 222
222 -
 223
223 -
 224
224 -
 225
225 -
 226
226 -
 227
227 -
 228
228 -
 229
229 -
230
-
231
-
232
-
233
-
234
-
235
-
236
-
237
-
238
-
239
-
240
-
241
-
242
-
243
-
244
-
245
-
246
-
247
-
248
-
249
-
250
-
251
-
252
-
253
-
254
-
255
-
256
-
257
-
258
-
259
-
260
-
261
-
262
-
263
-
264
-
265
-
266
-
267
-
268
-
269
-
270
-
271
-
272
-
273
-
274
-
275
-
276
-
277
-
278
-
279
-
280
-
281
-
282
-
283
-
284
-
285
-
286
-
287
-
288
-
289
-
290
-
291
-
292
-
293
-
294
-
295
-
296
-
297
-
298
-
299
-
300
-
301
-
302
 |
 |

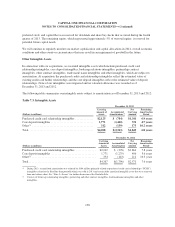
CAPITAL ONE FINANCIAL CORPORATION
NOTES TO CONSOLIDATED FINANCIAL STATEMENTS—(Continued)
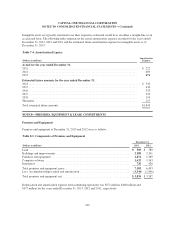
Intangible assets are typically amortized over their respective estimated useful lives on either a straight-line or an
accelerated basis. The following table summarizes the actual amortization expense recorded for the years ended
December 31, 2013, 2012 and 2011 and the estimated future amortization expense for intangible assets as of
December 31, 2013:
Table 7.4: Amortization Expense
(Dollars in millions)
Amortization
Expense
Actual for the year ended December 31,
2011 ............................................................................ $ 222
2012 ............................................................................ 609
2013 ............................................................................ 671
Estimated future amounts for the year ended December 31,
2014 ............................................................................ $ 532
2015 ............................................................................ 430
2016 ............................................................................ 333
2017 ............................................................................ 239
2018 ............................................................................ 154
Thereafter ....................................................................... 157
Total estimated future amounts ....................................................... $1,845
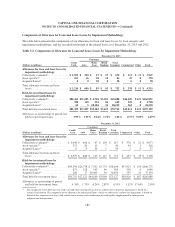
NOTE 8—PREMISES, EQUIPMENT & LEASE COMMITMENTS
Premises and Equipment
Premises and equipment at December 31, 2013 and 2012 were as follows:
Table 8.1: Components of Premises and Equipment
December 31,
(Dollars in millions) 2013 2012
Land ...................................................................... $ 569 $ 580
Buildings and improvements ................................................... 2,388 2,341
Furniture and equipment ....................................................... 1,874 1,589
Computer software ........................................................... 1,632 1,563
In progress ................................................................. 720 420
Total premises and equipment, gross ............................................. 7,183 6,493
Less: Accumulated depreciation and amortization ................................... (3,344) (2,906)
Total premises and equipment, net ............................................... $ 3,839 $ 3,587
Depreciation and amortization expense from continuing operations was $571 million, $468 million and
$317 million for the years ended December 31, 2013, 2012 and 2011, respectively.
199