Capital One 2013 Annual Report Download - page 246
Download and view the complete annual report
Please find page 246 of the 2013 Capital One annual report below. You can navigate through the pages in the report by either clicking on the pages listed below, or by using the keyword search tool below to find specific information within the annual report.-
 1
1 -
2
-
3
-
4
-
5
-
6
-
7
-
8
-
9
-
10
-
11
-
12
-
13
-
14
-
15
-
16
-
17
-
18
-
19
-
20
-
21
-
22
-
23
-
24
-
25
-
26
-
27
-
28
-
29
-
30
-
31
-
32
-
33
-
34
-
35
-
36
-
37
-
38
-
39
-
40
-
41
-
42
-
43
-
44
-
45
-
46
-
47
-
48
-
49
-
50
-
51
-
52
-
53
-
54
-
55
-
56
-
57
-
58
-
59
-
60
-
61
-
62
-
63
-
64
-
65
-
66
-
67
-
68
-
69
-
70
-
71
-
72
-
73
-
74
-
75
-
76
-
77
-
78
-
79
-
80
-
81
-
82
-
83
-
84
-
85
-
86
-
87
-
88
-
89
-
90
-
91
-
92
-
93
-
94
-
95
-
96
-
97
-
98
-
99
-
100
-
101
-
102
-
103
-
104
-
105
-
106
-
107
-
108
-
109
-
110
-
111
-
112
-
113
-
114
-
115
-
116
-
117
-
118
-
119
-
120
-
121
-
122
-
123
-
124
-
125
-
126
-
127
-
128
-
129
-
130
-
131
-
132
-
133
-
134
-
135
-
136
-
137
-
138
-
139
-
140
-
141
-
142
-
143
-
144
-
145
-
146
-
147
-
148
-
149
-
150
-
151
-
152
-
153
-
154
-
155
-
156
-
157
-
158
-
159
-
160
-
161
-
162
-
163
-
164
-
165
-
166
-
167
-
168
-
169
-
170
-
171
-
172
-
173
-
174
-
175
-
176
-
177
-
178
-
179
-
180
-
181
-
182
-
183
-
184
-
185
-
186
-
187
-
188
-
189
-
190
-
191
-
192
-
193
-
194
-
195
-
196
-
197
-
198
-
199
-
200
-
201
-
202
-
203
-
204
-
205
-
206
-
207
-
208
-
209
-
210
-
211
-
212
-
213
-
214
-
215
-
216
-
217
-
218
-
219
-
220
-
221
-
222
-
223
-
224
-
225
-
226
-
227
-
228
-
229
-
230
-
231
-
232
-
233
-
234
-
235
-
 236
236 -
 237
237 -
 238
238 -
 239
239 -
 240
240 -
 241
241 -
 242
242 -
 243
243 -
 244
244 -
 245
245 -
 246
246 -
 247
247 -
 248
248 -
 249
249 -
 250
250 -
 251
251 -
 252
252 -
 253
253 -
 254
254 -
 255
255 -
 256
256 -
257
-
258
-
259
-
260
-
261
-
262
-
263
-
264
-
265
-
266
-
267
-
268
-
269
-
270
-
271
-
272
-
273
-
274
-
275
-
276
-
277
-
278
-
279
-
280
-
281
-
282
-
283
-
284
-
285
-
286
-
287
-
288
-
289
-
290
-
291
-
292
-
293
-
294
-
295
-
296
-
297
-
298
-
299
-
300
-
301
-
302
 |
 |

CAPITAL ONE FINANCIAL CORPORATION
NOTES TO CONSOLIDATED FINANCIAL STATEMENTS—(Continued)
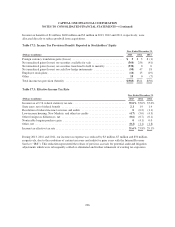
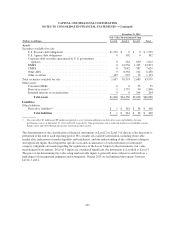
Income tax benefits of $1 million, $620 million and $3 million in 2013, 2012 and 2011, respectively, were
allocated directly to reduce goodwill from acquisitions.
Table 17.2: Income Tax Provision (Benefit) Reported in Stockholders’ Equity
Year Ended December 31,
(Dollars in millions) 2013 2012 2011
Foreign currency translation gains (losses) .................................... $5$ 3 $ (1)
Net unrealized gains (losses) on securities available for sale ...................... (364) 256 (41)
Net unrealized gains (losses) on securities transfered to held to maturity ............. (538) 00
Net unrealized gains (losses) on cash flow hedge instruments ..................... (95) 47 18
Employee stock plans ..................................................... (10) 15 (19)
Other .................................................................. 19 0 (7)
Total income tax provision (benefit) ......................................... $(983) $321 $(50)
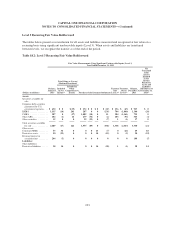
Table 17.3: Effective Income Tax Rate
Year Ended December 31,
(Dollars in millions) 2013 2012 2011
Income tax at U.S. federal statutory tax rate ..................................... 35.0% 35.0% 35.0%
State taxes, net of federal benefit ............................................. 2.1 1.9 1.4
Resolution of federal income tax issues and audits ............................... 0(0.2) (1.1)
Low-income housing, New Markets, and other tax credits ......................... (4.7) (5.0) (4.3)
Other foreign tax differences, net ............................................. (0.6) (0.7) (0.1)
Nontaxable bargain purchase gain ............................................ 0(4.1) 0.0
Other, net ................................................................ (0.2) (1.1) (1.8)
Income tax effective tax rate ................................................. 31.6% 25.8% 29.1%
During 2013, 2012 and 2011, our income tax expense was reduced by $3 million, $7 million and $50 million,
respectively, due to the resolution of certain tax issues and audits for prior years with the Internal Revenue
Service (“IRS”). This reduction represented the release of previous accruals for potential audit and litigation
adjustments which were subsequently settled or eliminated and further refinement of existing tax exposures.
226