Capital One 2013 Annual Report Download - page 189
Download and view the complete annual report
Please find page 189 of the 2013 Capital One annual report below. You can navigate through the pages in the report by either clicking on the pages listed below, or by using the keyword search tool below to find specific information within the annual report.-
 1
1 -
2
-
3
-
4
-
5
-
6
-
7
-
8
-
9
-
10
-
11
-
12
-
13
-
14
-
15
-
16
-
17
-
18
-
19
-
20
-
21
-
22
-
23
-
24
-
25
-
26
-
27
-
28
-
29
-
30
-
31
-
32
-
33
-
34
-
35
-
36
-
37
-
38
-
39
-
40
-
41
-
42
-
43
-
44
-
45
-
46
-
47
-
48
-
49
-
50
-
51
-
52
-
53
-
54
-
55
-
56
-
57
-
58
-
59
-
60
-
61
-
62
-
63
-
64
-
65
-
66
-
67
-
68
-
69
-
70
-
71
-
72
-
73
-
74
-
75
-
76
-
77
-
78
-
79
-
80
-
81
-
82
-
83
-
84
-
85
-
86
-
87
-
88
-
89
-
90
-
91
-
92
-
93
-
94
-
95
-
96
-
97
-
98
-
99
-
100
-
101
-
102
-
103
-
104
-
105
-
106
-
107
-
108
-
109
-
110
-
111
-
112
-
113
-
114
-
115
-
116
-
117
-
118
-
119
-
120
-
121
-
122
-
123
-
124
-
125
-
126
-
127
-
128
-
129
-
130
-
131
-
132
-
133
-
134
-
135
-
136
-
137
-
138
-
139
-
140
-
141
-
142
-
143
-
144
-
145
-
146
-
147
-
148
-
149
-
150
-
151
-
152
-
153
-
154
-
155
-
156
-
157
-
158
-
159
-
160
-
161
-
162
-
163
-
164
-
165
-
166
-
167
-
168
-
169
-
170
-
171
-
172
-
173
-
174
-
175
-
176
-
177
-
178
-
 179
179 -
 180
180 -
 181
181 -
 182
182 -
 183
183 -
 184
184 -
 185
185 -
 186
186 -
 187
187 -
 188
188 -
 189
189 -
 190
190 -
 191
191 -
 192
192 -
 193
193 -
 194
194 -
 195
195 -
 196
196 -
 197
197 -
 198
198 -
 199
199 -
200
-
201
-
202
-
203
-
204
-
205
-
206
-
207
-
208
-
209
-
210
-
211
-
212
-
213
-
214
-
215
-
216
-
217
-
218
-
219
-
220
-
221
-
222
-
223
-
224
-
225
-
226
-
227
-
228
-
229
-
230
-
231
-
232
-
233
-
234
-
235
-
236
-
237
-
238
-
239
-
240
-
241
-
242
-
243
-
244
-
245
-
246
-
247
-
248
-
249
-
250
-
251
-
252
-
253
-
254
-
255
-
256
-
257
-
258
-
259
-
260
-
261
-
262
-
263
-
264
-
265
-
266
-
267
-
268
-
269
-
270
-
271
-
272
-
273
-
274
-
275
-
276
-
277
-
278
-
279
-
280
-
281
-
282
-
283
-
284
-
285
-
286
-
287
-
288
-
289
-
290
-
291
-
292
-
293
-
294
-
295
-
296
-
297
-
298
-
299
-
300
-
301
-
302
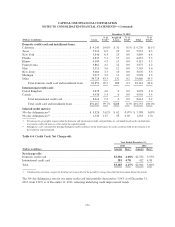
 |
 |

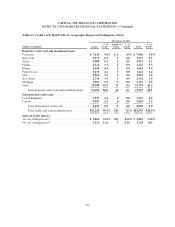
CAPITAL ONE FINANCIAL CORPORATION
NOTES TO CONSOLIDATED FINANCIAL STATEMENTS—(Continued)
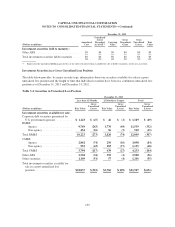
December 31, 2012
(Dollars in millions) Current
30-59
Days
60-89
Days
> 90
Days
Total
Delinquent
Loans
Acquired
Loans
Total
Loans
> 90 Days
and
Accruing(1)
Nonperforming
Loans(1)
Credit Card:
Domestic credit card .............. $ 79,852 $ 932 $ 659 $1,410 $3,001 $ 288 $ 83,141 $1,410 $ 0
International credit card ............ 8,227 145 89 153 387 0 8,614 100 100
Total credit card .............. 88,079 1,077 748 1,563 3,388 288 91,755 1,510 100
Consumer Banking:
Auto ........................... 25,057 1,341 559 149 2,049 17 27,123 0 149
Home loan ...................... 7,317 63 29 288 380 36,403 44,100 0 422
Retail banking ................... 3,789 26 10 45 81 34 3,904 1 71
Total consumer banking ........ 36,163 1,430 598 482 2,510 36,454 75,127 1 642
Commercial Banking:
Commercial and multifamily real
estate ......................... 17,357 64 77 107 248 127 17,732 2 137
Commercial and industrial .......... 19,525 57 3 75 135 232 19,892 14 133
Total commercial lending ...... 36,882 121 80 182 383 359 37,624 16 270
Small-ticket commercial real estate . . . 1,153 28 9 6 43 0 1,196 0 12
Total commercial banking ...... 38,035 149 89 188 426 359 38,820 16 282
Other:
Other loans ...................... 118 8 5 23 36 33 187 0 30
Total ........................... $162,395 $2,664 $1,440 $2,256 $6,360 $37,134 $205,889 $1,527 $1,054
% of Total loans .................. 78.9% 1.3% 0.7% 1.1% 3.1% 18.0% 100.0% 0.7% 0.5%
(1) Nonperforming loans generally include loans that have been placed on nonaccrual status. Acquired Loans are excluded from loans
reported as 90 days and accruing interest as well as nonperforming loans.
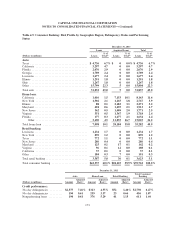
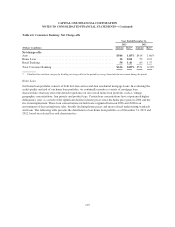
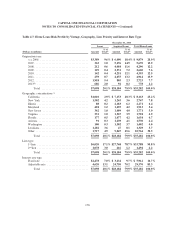
Credit Card
Our credit card loan portfolio is generally highly diversified across millions of accounts and multiple geographies
without significant individual exposures. We therefore generally manage credit risk on a portfolio basis. The risk
in our credit card portfolio is correlated with broad economic trends, such as unemployment rates, gross domestic
product (“GDP”), and home values, as well as customer liquidity, which can have a material effect on credit
performance. The primary factors we assess in monitoring the credit quality and risk of our credit card portfolio
are delinquency and charge-off trends, including an analysis of the migration of loans between delinquency
categories over time. The table below displays the geographic profile of our credit card loan portfolio and
delinquency statistics as of December 31, 2013 and 2012. We also present comparative net charge-offs for the
years ended December 31, 2013 and 2012.
169