Capital One 2013 Annual Report Download - page 103
Download and view the complete annual report
Please find page 103 of the 2013 Capital One annual report below. You can navigate through the pages in the report by either clicking on the pages listed below, or by using the keyword search tool below to find specific information within the annual report.-
 1
1 -
2
-
3
-
4
-
5
-
6
-
7
-
8
-
9
-
10
-
11
-
12
-
13
-
14
-
15
-
16
-
17
-
18
-
19
-
20
-
21
-
22
-
23
-
24
-
25
-
26
-
27
-
28
-
29
-
30
-
31
-
32
-
33
-
34
-
35
-
36
-
37
-
38
-
39
-
40
-
41
-
42
-
43
-
44
-
45
-
46
-
47
-
48
-
49
-
50
-
51
-
52
-
53
-
54
-
55
-
56
-
57
-
58
-
59
-
60
-
61
-
62
-
63
-
64
-
65
-
66
-
67
-
68
-
69
-
70
-
71
-
72
-
73
-
74
-
75
-
76
-
77
-
78
-
79
-
80
-
81
-
82
-
83
-
84
-
85
-
86
-
87
-
88
-
89
-
90
-
91
-
92
-
 93
93 -
 94
94 -
 95
95 -
 96
96 -
 97
97 -
 98
98 -
 99
99 -
 100
100 -
 101
101 -
 102
102 -
 103
103 -
 104
104 -
 105
105 -
 106
106 -
 107
107 -
 108
108 -
 109
109 -
 110
110 -
 111
111 -
 112
112 -
 113
113 -
114
-
115
-
116
-
117
-
118
-
119
-
120
-
121
-
122
-
123
-
124
-
125
-
126
-
127
-
128
-
129
-
130
-
131
-
132
-
133
-
134
-
135
-
136
-
137
-
138
-
139
-
140
-
141
-
142
-
143
-
144
-
145
-
146
-
147
-
148
-
149
-
150
-
151
-
152
-
153
-
154
-
155
-
156
-
157
-
158
-
159
-
160
-
161
-
162
-
163
-
164
-
165
-
166
-
167
-
168
-
169
-
170
-
171
-
172
-
173
-
174
-
175
-
176
-
177
-
178
-
179
-
180
-
181
-
182
-
183
-
184
-
185
-
186
-
187
-
188
-
189
-
190
-
191
-
192
-
193
-
194
-
195
-
196
-
197
-
198
-
199
-
200
-
201
-
202
-
203
-
204
-
205
-
206
-
207
-
208
-
209
-
210
-
211
-
212
-
213
-
214
-
215
-
216
-
217
-
218
-
219
-
220
-
221
-
222
-
223
-
224
-
225
-
226
-
227
-
228
-
229
-
230
-
231
-
232
-
233
-
234
-
235
-
236
-
237
-
238
-
239
-
240
-
241
-
242
-
243
-
244
-
245
-
246
-
247
-
248
-
249
-
250
-
251
-
252
-
253
-
254
-
255
-
256
-
257
-
258
-
259
-
260
-
261
-
262
-
263
-
264
-
265
-
266
-
267
-
268
-
269
-
270
-
271
-
272
-
273
-
274
-
275
-
276
-
277
-
278
-
279
-
280
-
281
-
282
-
283
-
284
-
285
-
286
-
287
-
288
-
289
-
290
-
291
-
292
-
293
-
294
-
295
-
296
-
297
-
298
-
299
-
300
-
301
-
302
 |
 |

Potential Mortgage Representation & Warranty Liabilities
We acquired three subsidiaries that originated residential mortgage loans and sold them to various purchasers,
including purchasers who created securitization trusts. These subsidiaries are Capital One Home Loans, which
was acquired in February 2005; GreenPoint, which was acquired in December 2006 as part of the North Fork
acquisition; and CCB, which was acquired in February 2009 and subsequently merged into CONA.
We have established representation and warranty reserves for losses associated with the mortgage loans sold by
each subsidiary that we consider to be both probable and reasonably estimable, including both litigation and non-
litigation liabilities. These reserves are reported in our consolidated balance sheets as a component of other
liabilities. The reserve setting process relies heavily on estimates, which are inherently uncertain, and requires the
application of judgment. We evaluate these estimates on a quarterly basis. We build our representation and
warranty reserves through the provision for mortgage representation and warranty losses, which we report in our
consolidated statements of income as a component of non-interest income for loans originated and sold by CCB
and Capital One Home Loans and as a component of discontinued operations for loans originated and sold by
GreenPoint. In establishing the representation and warranty reserves, we consider a variety of factors depending
on the category of purchaser.
The aggregate reserves for all three subsidiaries totaled $1.2 billion as of December 31, 2013, compared with
$899 million as of December 31, 2012.
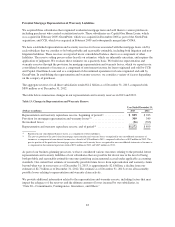
The table below summarizes changes in our representation and warranty reserves in 2013 and 2012.
Table 13: Changes in Representation and Warranty Reserve
Year Ended December 31,
(Dollars in millions) 2013 2012
Representation and warranty repurchase reserve, beginning of period(1) .............. $ 899 $ 943
Provision for mortgage representation and warranty losses(2) ...................... 309 349
Net realized losses ........................................................ (36) (393)
Representation and warranty repurchase reserve, end of period(1) ................... $1,172 $ 899
(1) Reported in our consolidated balance sheets as a component of other liabilities.
(2) The pre-tax portion of the provision for mortgage representation and warranty losses recognized in our consolidated statements of
income as a component of non-interest income was a benefit of $24 million in 2013, compared with a loss of $42 million in 2012. The
pre-tax portion of the provision for mortgage representation and warranty losses recognized in our consolidated statements of income as
a component of discontinued operations totaled $333 million in 2013 and $307 million in 2012.
As part of our business planning processes, we have considered various outcomes relating to the potential future
representation and warranty liabilities of our subsidiaries that are possible but do not rise to the level of being
both probable and reasonably estimable outcomes justifying an incremental accrual under applicable accounting
standards. Our current best estimate of reasonably possible future losses from representation and warranty claims
beyond what was in our reserve as of December 31, 2013, is approximately $2.6 billion, a decline from our
estimate of $2.7 billion as of December 31, 2012. The estimate as of December 31, 2013 covers all reasonably
possible losses relating to representation and warranty claim activity.
We provide additional information related to the representation and warranty reserve, including factors that may
impact the adequacy of the reserves and the ultimate amount of losses incurred by our subsidiaries, in
“Note 20—Commitments, Contingencies, Guarantees, and Others.”
83